
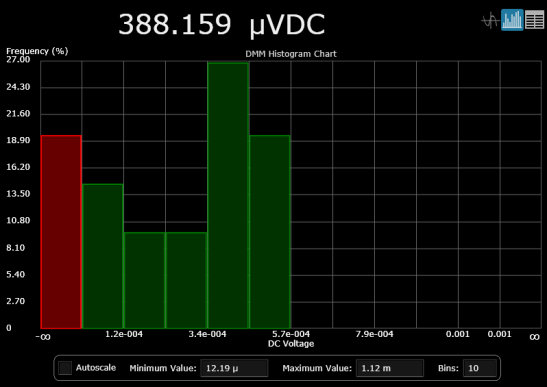
View data as a histogram. Groups are plotted on the x-axis using the units of measurement (volts, ohms, current, etc.), frequencies are plotted on the y-axis.
When the check box is selected, all measurement data is automatically assigned to bins and displayed. When the check box is cleared, you can specify a Minimum Value and Maximum Value to be assigned to bins, and the number of bins (see below). Data in bins are shown in green and data outside of bins are shown in red.
Specify the lowest measured value to include in the histogram. For example, 1 Vdc (for DC voltage measurements) or 20 Hz (for frequency measurements).
Specify the highest measured value to include in the histogram. For example, 10 Vdc (for DC voltage measurements) or 200 Hz (for frequency measurements).
Set the number of bins (containers that accumulate data). Data in bins are shown in green and data outside of bins are shown in red.
Right-click anywhere on the chart to display these options:
Save Chart Image to File - Export a screen shot of the chart to a JPEG, BMP, or PNG file. For all file formats, the chart is saved with a white grid on a black background. By default, the screen shot is stored in the "My Documents" folder on your computer. For example – C:\Users\<user_name>\Documents\Keysight\BenchVue\Digital Multimeter\Exports\.
Copy Chart Image to Clipboard - Export a screen shot of the chart to the Windows clipboard.