From the Display 1 or Display 2 tab, click the CCDF  button to create a new display view. Up to four display views can be added per tab.
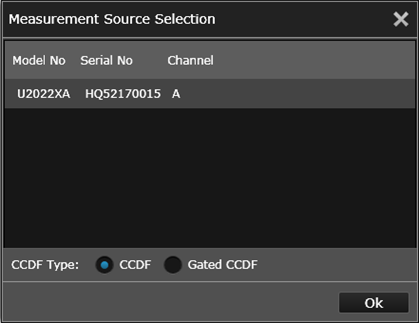
 button (near the top of the Display tab) and select the desired measurement.
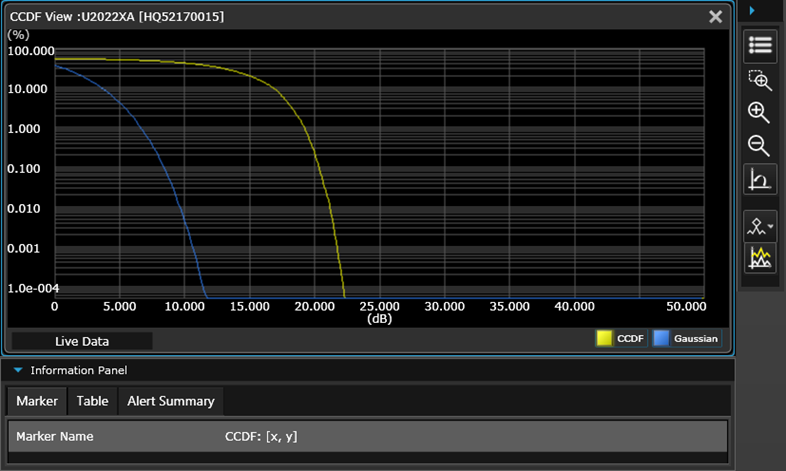
Use this view to create a Complementary Cumulative Distribution Function (CCDF) graph display view or to create a Gated CCDF graph display view. CCDF curves characterize the higher-level power statistics of a digitally-modulated signal and are defined by the percentage of time the signal power is at or above a given power level.
From the Display 1 or Display 2 tab, click the CCDF button to create a new display view. Up to four display views can be added per tab.
button (near the top of the Display tab) and select the desired measurement. On the right side of the current display view, a Tools Palette provides controls for the following display options.

|
Change the title at the top of the current display view. You can also set the X-axis and y-axis parameters (minimum/maximum) for the displayed chart. For precise control of your x-axis and y-axis scales, click here. |

|
Area zoom. Use the mouse to draw a frame around the desired area of the graph to zoom in on. |

|
Zoom in horizontally. To zoom in vertically only, click the waveform (waveform turns into a thick line) and zoom in. Click the waveform again to return to the normal zoom mode. |

|
Zoom out horizontally. To zoom out vertically only, click the waveform (waveform turns into a thick line) and zoom out. Click the waveform again to return to the normal zoom mode. |

|
Reset scale the trace to defaults on both the x- and y-axis. |

|
Add up to five markers to the chart. To delete a marker, click this button again and unselect the desired marker from the drop-down list. |

|
Assign a reference trace. |
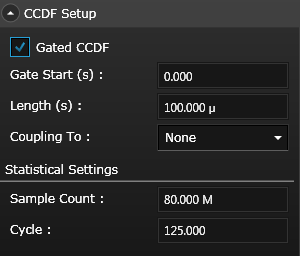
For more precise control of your parameters for Gated CCDF measurements, select the Instrument Setup tab and then go to the "CCDF Setup" pane. From there you can enter the gate parameters shown below.
Right-click anywhere on the chart to display these options:
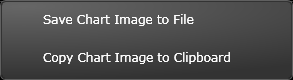
Save Chart Image to File - Export a screen shot of the chart to a JPEG, BMP, or PNG file, with a white grid on a black background. By default, the screen shot is stored in the "My Documents" folder on your computer. For example – C:\Users\<user_name>\Documents\Keysight\BenchVue\Power Meter\Exports\.
Copy Chart Image to Clipboard - Export a screen shot of the chart to the Windows clipboard.
 button next to the "Measurement" properties drop-down pane. Measurements and operations will be displayed in real time. To stop the measurement acquisition for this view, click the
  button next to the "Measurement" properties drop-down pane.
 button located at the bottom of the Settings tab. Measurements and operations will be displayed in real time. To stop all assigned measurements on all display views simultaneously, click the
  button located at the bottom of the Settings tab.
As shown in the screen capture above, an Information Panel drop-down is provided under the current display view. This panel summarizes important measurement information for the current display view.
Marker Summary - Click this tab for a summary of the Marker measurements for the current trace view.
Table Summary - Click this tab for a summary of measurement parameters in tabular format.
Alert Summary - Click this tab for a summary of Alert Limit conditions for the current measurement. For more information, see Set Measurement Alert Limits.