 button or the
  button to generate the data for selected channels.
The Continuous Data, Single Shot Data, and Polling Data tabs display acquired AI signals for selected channels.
Note: The specific features and functionality available in BenchVue will vary depending on the instrument and model number. Some of the parameters and functionality described here might not be available for your particular instrument. The bench application will show only those parameters, and parameter ranges, available for your particular instrument. Although the specific configuration properties vary by the DAQ model number, the primary elements of the bench application will be the same. In this case, the U2356A model is used as an example in the following description.
Click the button or the button to generate the data for selected channels.
The Continuous Data tab displays continuous acquisition data as traces for selected channels.

To select specific channels (traces) to display on the chart, go to the Select Channels/Markers pane on the right, click on the Channel tab, and then select the desired channels.

|
Set the x-axis grid labels. Select from "Relative to Zero" (default), "Date Time" in local time, or "Date Time (UTC)" relative to Universal Time Coordinated time. |

|
Show vertical markers. Click |

|
Area zoom. Use the mouse to draw a frame around the desired area of the graph to zoom in on. |

|
Zoom in horizontally. To zoom in vertically only, click on the waveform (waveform turns into a thick line) and zoom in. Click the waveform again to return to the normal zoom mode. |

|
Zoom out horizontally. To zoom out vertically only, click on the waveform (waveform turns into a thick line) and zoom out. Click the waveform again to return to the normal zoom mode. |

|
Auto scale the trace on both the x- and y-axis. |
To add markers to the graph chart, go to the Select Channels/Markers pane on the right, click on the Marker tab, and then select the desired channel for each marker. To obtain the readings for specific points on the plot, place the cursor on the marker and drag the marker on the points to be measured. The readings will be displayed below the graph chart.
Right-click anywhere on the graph chart to display these options:
Save Chart Image to File - Export a screen shot of the chart to a JPEG, BMP, or PNG file. The JPEG and BMP formats save the preview with a yellow trace on a black background; the PNG format saves the preview with a colored trace on a white background. By default, the screen shot is stored in the "My Documents" folder on your computer. For example – C:\Users\<user_name>\Documents\Keysight\BenchVue\USB Modular Data Acquisition\Exports\.
Copy Chart Image to Clipboard - Export a screen shot of the chart to the Windows clipboard.
The Single Shot Data tab displays single shot acquisition data in a tabular format for selected channels.
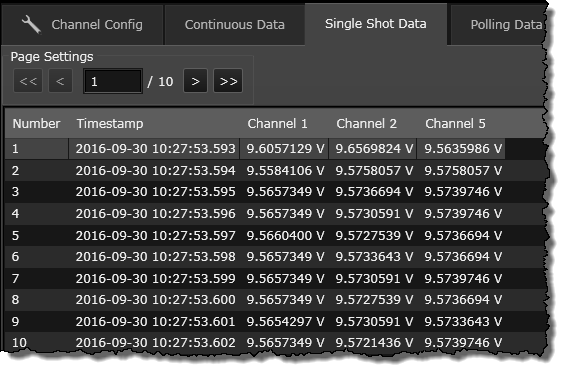
Use the Page Settings browse controls (<<, <, >, >>) to navigate the panel's list of displayed data.
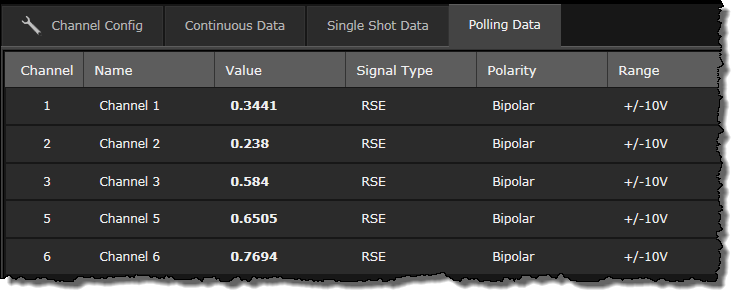
The Polling Data tab displays polling acquisition data in a tabular format for selected channels.
 to hide the vertical markers. See