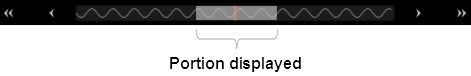
The Data Preview Bar gives a visual indication of the portion of the data that is currently displayed in the chart. The area highlighted in grey is the portion of the data that is currently displayed.
Use the browse controls (<<, <, >, >>) to traverse the displayed data.
Use the zoom controls to view more or less of the displayed data.