IO Monitor Information Flow
IO Monitor receives tracing/debugging information from IO library sources and other software components. The individual pieces of information that sources generate are called (trace) events. Although IO Monitor is the destination for tracing information, the flow of information is not always unidirectional. IO Monitor must be able to control its sources, for example turning tracing on and off or changing tracing parameters dynamically. Therefore, the flow of information between IO Monitor and its sources is bidirectional and asynchronous.
Flow diagram (Windows)
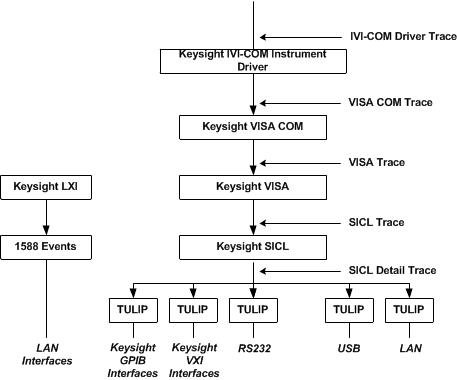
The VISA and SICL trace points in the previous graphic are valid entry points to controlling your instrument. For VISA tracing to work, the Keysight VISA libraries are required. The SICL Detail Trace captures the lowest level interaction between the instrument driver and the instrument and is often the most useful of the traces.
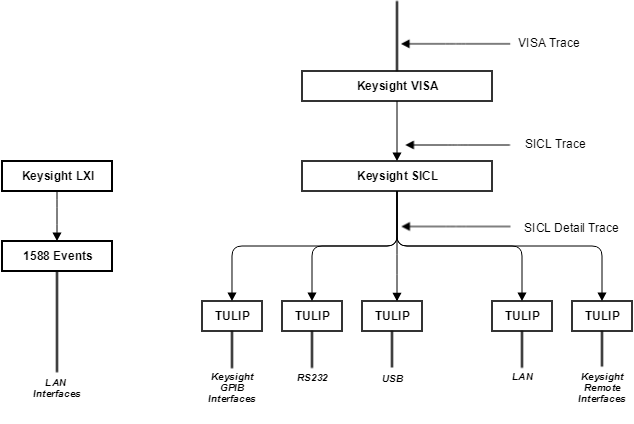
Flow diagram (Linux)
IO Monitor Benefits
- You can correlate higher level calls from sources like Interactive IO, or anyone using SICL, VISA, or VISA-COM with the corresponding lower level API. (
VISA-COM is Windows only).
- You can see the instrument command sequences sent to a device by a specific device driver or high level I/O application.
- When you have problems with your programs, such as not getting the expected results or receiving errors from devices, you can trace your programs, log the trace to a file, and then send the file to the Keysight support team for help.
- If you have an I/O bottleneck, use IO Monitor to trace the calls to the API and to track where time is being spent.

IO Monitor is not a performance measuring tool because the IO Monitor itself affects performance.
Only one session of IO Monitor can run at any time per machine.