Understanding the IO Monitor Display
IO Monitor displays messages originating from VISA APIs. It allows you to automatically group relevant asynchronous VISA APIs, accumulate the time spent on them, and present the aggregated data and elapsed time as a single API entry. This feature mimics the behavior of synchronous viRead/viWrite APIs, providing a clearer overview of asynchronous operations.
Note that this feature is configurable and is disabled by default. Users must update the IO Monitor settings to enable it.
The IO Monitor display is split into an overview section at the top and an detail section at the bottom.
- In the overview section, IO Monitor displays the basic information for each I/O message.
- In the detail section, IO Monitor displays detailed information about an I/O message you have chosen. Refer to Monitoring I/O Messages on the Display for a description of I/O messages.
IO Monitor Display
| # | Description |
|---|---|
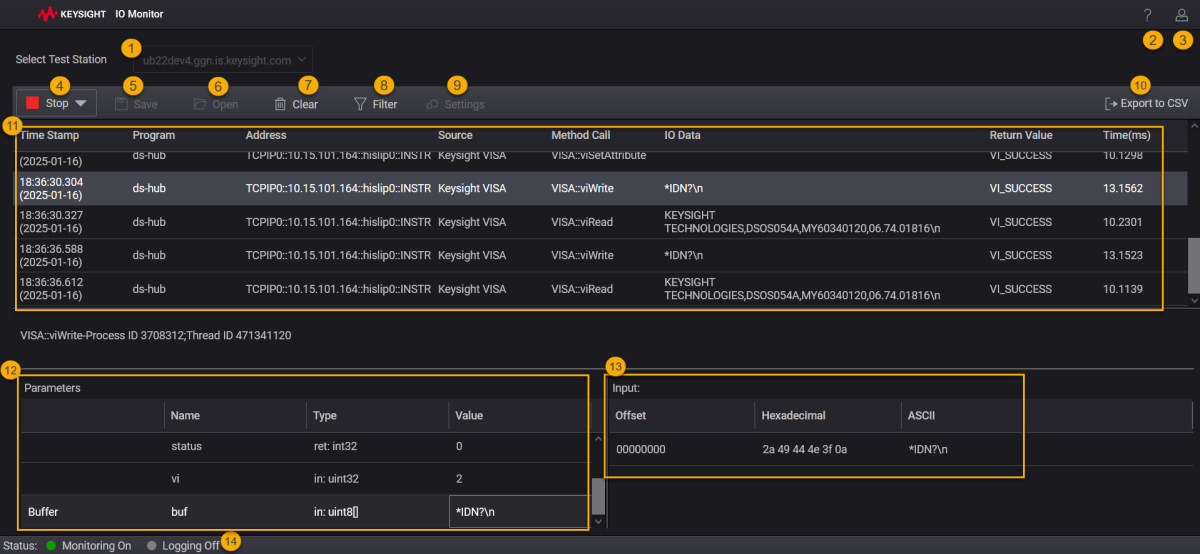
| 1 | The Select Test Station drop down displays the name of the connected Test Station. In future this drop down will be enabled to choose from multiple test stations. |
| 2 |
 : Opens IO Monitor Help and provides technical support contact information. : Opens IO Monitor Help and provides technical support contact information. |
| 3 |
 : The user profile view lets you switch between the dark and light themes and log out from IO Monitor. : The user profile view lets you switch between the dark and light themes and log out from IO Monitor. |
| 4 |
Start: Starts capturing messages originating from the selected IO Libraries functions. On clicking Start, the button switches to Stop allowing you to stop capturing messages.
|
| 5 | Save: Saves currently displayed messages as an .xml log file |
| 6 | Open: Opens a dialog where you can view the existing files. Select the file to open. |
| 7 | Clear - Clears messages from the display. |
| 8 | Filter - Filters the message list as per the search criteria. |
| 9 | Settings - Opens the IO Monitor Settings dialog. |
| 10 | The Export to CSV lets you export the complete list of messages (visible on the screen) to a CSV file.
On clicking Export to CSV, the file will download on the default download location on the system. |
| 11 |
The Overview Section is divided into eight columns. From left to right, they are:
|
| 12 |
The detail section shows the parameter(s) for the selected entry. The Parameters section has these columns:
Buffer and array parameters are listed in blue text in the Parameters section. Click on one of these parameters to display the buffer or array details in the section to the right. The details for a buffer are:
Arrays can contain 16-, 32-, or 64-bit data. The details for an array are: For example, the graphic below (Windows is shown; Linux content is comparable) shows details of a buffer. |
| 13 |
Buffer and array parameters are listed in blue text in the Parameters section. Click on one of these parameters to display the buffer or array details in the section to the right. The details for a buffer are:
|
| 14 | The status description at the bottom of the display alerts you to whether monitoring is on or off, and whether logging is enabled or disabled. |