|
|
BenchVue Oscilloscope Application Help |
Welcome
This help system contains information on the PathWave BenchVue Oscilloscope application. This application provides easy access to data collection and data analysis for the oscilloscopes on your workbench.
The specific features and functionality available in this application will vary depending on the instrument and model number. Some of the parameters and functionality described here might not be available for your particular instrument. The application will show only those parameters, and parameter ranges, available for your specific instrument.
PathWave Software Licensing (Premium Installer)
Keysight's flexible licensing options allow you to select the license type and license terms that best fit your software needs. To use the application, you will be required to purchase a software license. For more information on purchasing and installing a software license, see Software Licensing Options.
To request a free trial license, go to the Information and Technical Support menu ("?" icon in upper left corner of the application) and select "License Management". From the license management screen, click "Get Trial or Buy License" and then click "Request a free trial license".
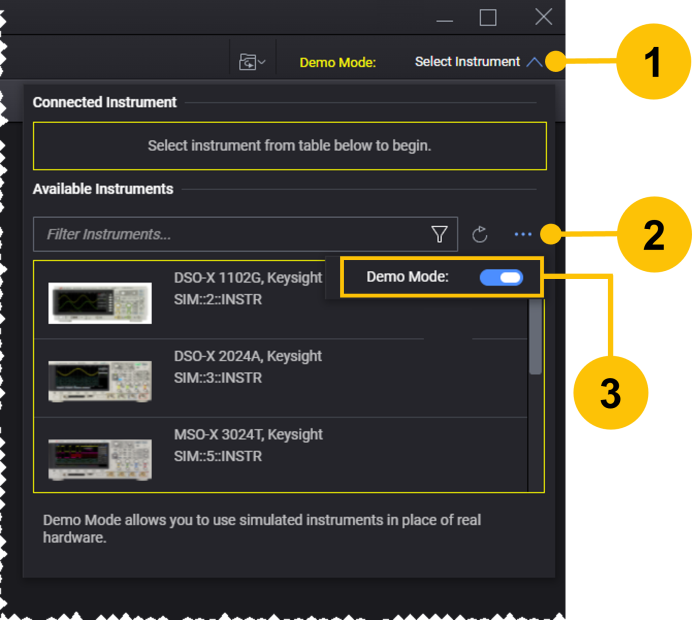
Demo Mode
You can use the Oscilloscope application without a software license in the Demo Mode which enables you to preview the application's features without being connected to an actual instrument.
To enable the Demo Mode, perform the following steps.
- Click the "Select Instrument" drop-down.
- Click the
 button under Available Instruments.
 - Click the "Demo Mode" switch.
BenchVue Test Flow
BenchVue Test Flow is an embedded application which runs within the BenchVue desktop. You can use the BenchVue Test Flow to quickly create and analyze automated tests – without any programming. With the intuitive drag-and-drop interface, Test Flow allows you to combine multiple instruments into an automated test for better characterization of your device-under-test. The specific controls and properties supported by Test Flow will vary depending on the instrument type and model number. For more information, see Create Automated Tests Using BenchVue Test Flow.
Graphical Overview of Application
To introduce you to the user interface elements of the Oscilloscope application, we have created a graphical overview below. Although the specific configuration properties vary by oscilloscope model number, the primary elements of the application will be the same.
Toolbar Overview
Top Toolbar
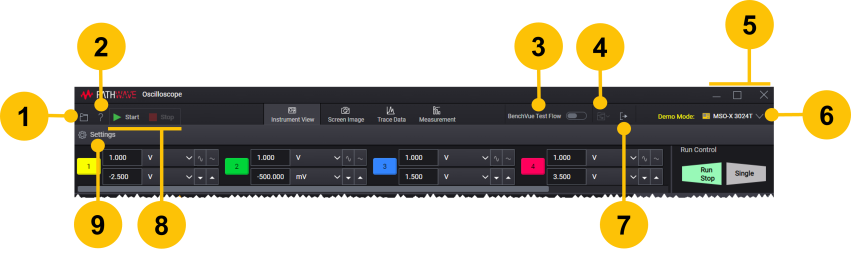
Bottom Toolbar
| 1 | Save instrument state to a file or load a previously-stored instrument state from a file. See Save Instrument State and Load Instrument State. | |
| 2 | Open the Information and Technical Support Menu to view the Help system and technical support information. | |
| 3 | Enable or disable the BenchVue Test Flow feature. See Create Automated Tests Using BenchVue Test Flow. | |
| 4 | While not connected to an instrument, load a file from your computer.
|
|
| 5 | Minimize, maximize, or close Oscilloscope application window. | |
| 6 | Instrument model currently connected to Oscilloscope application. From the "Select Instrument" drop-down, you can also enable or disable Demo Mode with simulated instruments and measurement data. For more information on connecting instruments, see Connect to Instruments. | |
| 7 | Export operations.
|
|
| 8 | Start or stop acquisitions on Oscilloscope application. | |
| 9 | Show or hide the "Settings" panel on left side of Oscilloscope application interface. | |
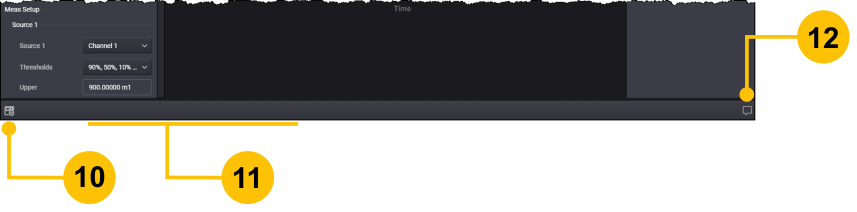
| 10 | Pause instrument IO communication between Oscilloscope application and instrument. See Pause Instrument Connection. | |
| 11 | Information, warning, and error messages are shown here for a few seconds. | |
| 12 | View information, warnings, and errors for the application. See Notifications. |
Instrument View Overview
Select the Instrument View to configure the oscilloscope's settings.
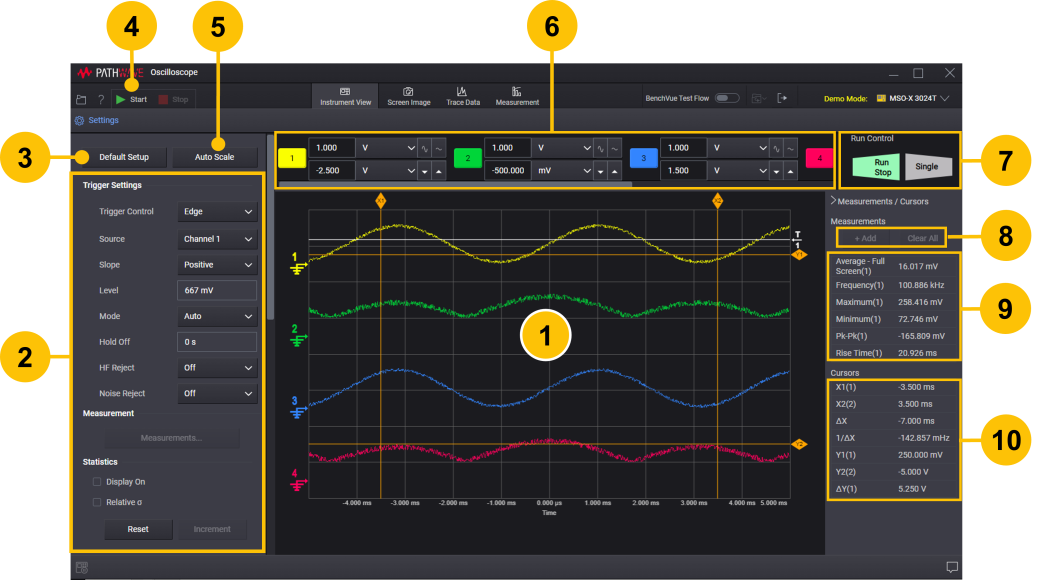
| 1 | Preview the oscilloscope settings. Click the "Start" button to start acquisitions. | |
| 2 | Configure the oscilloscope settings, including measurement configuration, cursor configuration, and trigger configuration. See Instrument Settings Panel. Show the controls for the optional WaveGen built-in waveform generator (not available on all models). See WaveGen Option Support. |
|
| 3 | Restore the oscilloscope to its default settings. This places the oscilloscope in a known operating condition. | |
| 4 | Arm trigger and capture trace data upon completion of measurement acquisition. | |
| 5 | Automatically configure the oscilloscope to best display the input signals. | |
| 6 | Control oscilloscope channels, and set scale and offset. See Instrument Settings Chart Controls. | |
| 7 | Start/stop the oscilloscope's acquisition system. See Instrument Run Control. | |
| 8 | Add new waveform measurements or remove all measurements. See Waveform Measurements. | |
| 9 | Show current waveform measurements on selected channels. See Waveform Measurements. | |
| 10 | Show cursors information. See Cursors Settings. |
Screen Image View Overview
Select the Screen Image view to capture the instrument's screen as an image.
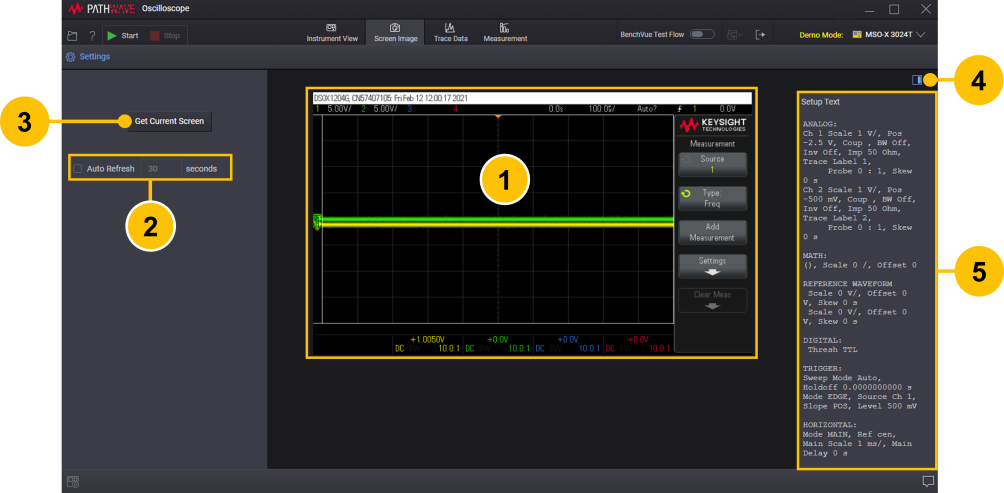
| 1 | View the current screen image from the oscilloscope's front-panel display. Click the "Start" button to start acquisitions. | |
| 2 | Set screen image viewing options for subsequent screen captures. See Capture Settings Panel. | |
| 3 | Capture the current screen image from the oscilloscope's front-panel display without initiating a new measurement. Click the "Start" button to trigger a new measurement prior to capturing a screen image. | |
| 4 | Show or hide the "Setup Text" panel below. See Setup Text. | |
| 5 | Show the oscilloscope's setup information. See Setup Text. |
Trace Data View Overview
Select the Trace Data view to capture the instrument's traces as measurement data.
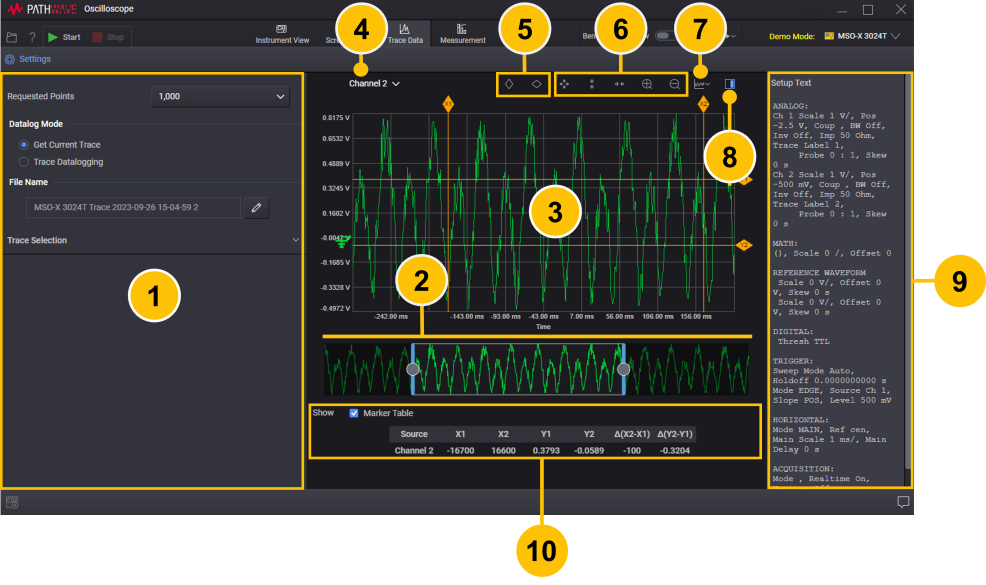
| 1 | Configure the traces display and data logging settings. See Trace Data Settings Panel. | |
| 2 | Show portion of data currently displayed on chart above. For Trace Datalogging mode, traverse the displayed data one window or one grid at a time, or click the number above the chart to display the desired portion of the trace. See Data Preview Bar. | |
| 3 | View the captured trace data or measurement information from the current data log. Click the "Start" button to start acquisitions. | |
| 4 | In Single Trace Chart view, select the desired source trace to be displayed in the chart. | |
| 5 | Show vertical (X1 and X2) and/or horizontal (Y1 and Y2) marker pair. Click again to hide the markers. Markers are available in Single Trace Chart view only. See Markers. | |
| 6 | Use Trace Display Toolbar to zoom in/out, and auto scale the displayed data. | |
| 7 | View the current trace data or measurement data as a Multiple Traces Chart or Single Trace Chart. | |
| 8 | For Get Current Trace mode, show or hide the "Setup Text" panel at right. See Setup Text. | |
| 9 | For Get Current Trace mode, show the oscilloscope's setup information. See Setup Text. | |
| 10 | The Marker Table shows the trace measurement data based on relative position of each marker. Marker Table is available in Single Trace Chart view only. See Markers. |
Measurement View Overview
Select the Measurement view to configure the instrument to log measurements over time.
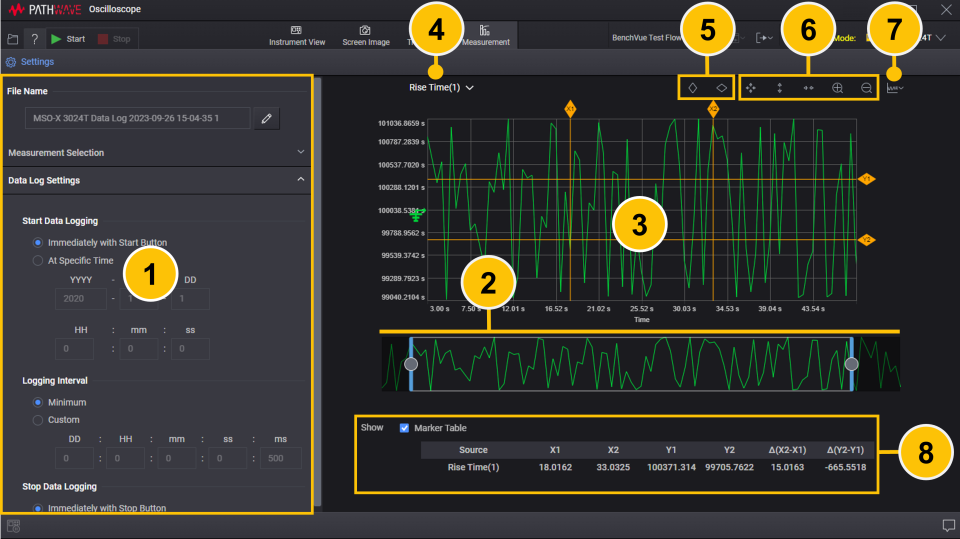
| 1 | Configure the data logging settings and select the measurements to be displayed on the data log chart . See Measurement Settings Panel. | |
| 2 | Show portion of data currently displayed on the chart above. See Data Preview Bar. | |
| 3 | View measurement information from the current data log. Click the "Start" button to start acquisitions. | |
| 4 | In Single Trace Chart view, select the desired source trace to be displayed in the chart. | |
| 5 | Show vertical (X1 and X2) and/or horizontal (Y1 and Y2) marker pair. Click again to hide the markers. Markers are available in Single Trace Chart view only. See Markers. | |
| 6 | Use Trace Display Toolbar to zoom in/out, and auto scale the displayed data. | |
| 7 | View measurement information from the current data log as a Multiple Traces Chart, Single Trace Chart, or Histogram. | |
| 8 | The Marker Table shows the trace measurement data based on relative position of each marker. Marker Table is available in Single Trace Chart view only. See Markers. |
See Also
Supported Instruments and Interfaces
System and Installation Requirements
Troubleshoot Instrument Connections
Help Version 2024.1 | 12 August 2024