
-
All test equipment requires a 30 minute warmup period to ensure accurate performance.
-
In the following test setup, cables are designated as solid lines and direct connections are designated as dashed lines.
Residual FM measures the unwanted frequency variation in the CW signal of the DUT.
This test supports two equipment setups:
A Phase Noise System is used to demodulate the signal and measure the deviation.
Alternatively, an 8902A measuring receiver is used to demodulate the signal and measure the deviation.
A Phase Noise System is used to measure the Residual FM by taking a single sideband phase noise measurement of the DUT. The area under the phase noise plot between 300 Hz and 3 kHz is the Residual FM.
|
Test Equipment |
Critical Specifications for This Test |
Recommended Models |
Alternate Models |
|
Phase Noise System |
|
N5511A Options 540, CH21
|
E5505A |
|
Reference Source1 |
|
E8257D2 Opt UNR or UNX or UNY |
8664A Opt 004, |
|
Cable |
|
8120-4921 APC 3.5 (m) to (m) |
|
|
Cable |
|
11500C Type-N (m) to (m) |
|
|
Cable |
|
8120-1840 BNC (m) to (m) |
|
|
Adapter |
|
E9625A BNC Tee (m) (f) (f) |
|
|
Adapter |
|
11901D 2.4 mm (f) to APC 3.5 (m) |
|
|
Adapter |
|
1250-1749 APC 3.5 (f) to (f) |
|
|
|
|
|
There are two sets of procedures depending on the model of the phase noise test system used:
N5511A Phase Noise Test System (PNTS), recommended phase noise test system
E550xA/B legacy phase noise test systems
Select from the links below according to the phase noise test system being used.
Connect all test equipment as shown.
Connect GPIB cables to all GPIB-controlled test equipment.
Preset all test equipment and the DUT.
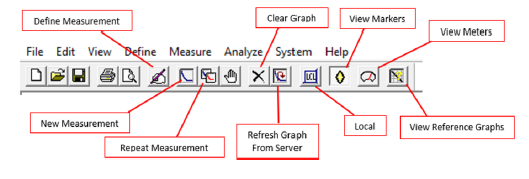
Change the following parameters in the N5510A PNTS user interface:
Select the View pull-down menu.
Select Display Preferences and un-check the Spurs box.
Select OK to close Display Preferences.
Select the System pull-down menu and select Server Hardware Connections.
Select or ensure the following:
FFT Analyzer has Keysight M9551A selected.
Select Close to close Server Hardware Connections.
Select the Define
pull-down menu, select Measurement, and select the
following settings:
|
Parameter |
Setting |
|
|
|
|
Type and Range Tab |
|
|
Measurement Type |
Absolute phase noise (using a phase locked loop) |
|
Measurement Method |
Fast |
|
Start Offset Resolution Expansion |
10 |
|
Channel Setup |
Single |
|
Start Offset Frequency |
290 Hz (must be < 300 Hz) |
|
Stop Offset Frequency |
3.1 kHz (must be > 3 kHz) |
|
FFT Analyzer Minimum Number of Trace Averages |
4 |
|
RBW % |
0.24 (8192 point FFT) |
|
FFT Overlap % |
75 |
|
FFT Window Type |
Flat Top |
|
|
|
|
Sources Tab |
|
|
Carrier Source Frequency |
Obtain tested frequencies from the TME data entry form. |
|
Carrier Source Power |
+10 dBm |
|
Detector Input Frequency |
Same as Carrier Source Frequency |
|
Reference Source Power |
+15 dBm to 3 GHz +10 dBm > 3 GHz |
|
VCO Nominal Tune Constant |
0.1 ppm x carrier source frequency |
|
VCO Tune Range |
1 Volt |
|
VCO Input Resistance |
50 Ω |
|
Center Voltage |
0 V |
|
|
|
|
Cal Tab |
|
|
Phase Detector Constant |
Derive detector constant from measured beat note |
|
VCO Tune Constant |
Measure VCO Tune Constant |
|
Verify calculated phase lock loop suppression |
Blank |
|
|
|
|
Block Diagram Tab |
|
|
Carrier Source |
Manual |
|
Reference Source |
Model number of reference source |
|
Phase Detector |
Automatic Detector Selection |
|
Test Set Tune Voltage Output |
Front Panel |
|
Test Set Tune Voltage Destination |
Reference Source |
|
VCO Tune Mode |
DCFM |
|
|
|
|
Test Set Tab |
|
|
LNA Low Pass Filter |
Internal — Selected Auto — Checked |
|
LNA Gain |
Auto Gain — Selected Minimum Auto Gain — 14 dB |
|
PLL Integrator Attenuation |
0 dB |
|
Use Channel #2 |
Unchecked |
|
|
|
|
Graph Tab |
|
|
Title |
User specified |
|
Graph Type |
Spectral Density of Phase Fluctuations (dB/Hz) |
|
X Scale minimum |
Same as start offset frequency |
|
X Scale maximum |
Same as stop offset frequency |
|
Y Scale maximum |
0 dB/Hz |
|
Y Scale minimum |
–170 dB/Hz |
|
Normalize Trace Data |
1 Hz bandwidth |

Making the Measurement
Set the DUT frequency to the first carrier frequency in the TME data entry form.
Set the DUT RF Output to On.
Perform a phase noise measurement.
Click on the Analyze pull-down menu and select Trace Integration.
Use the following settings:
|
Parameter |
Actual Offset |
|
Data Type |
Snu(f) (Spectral density of frequency fluctuations) |
|
CCIT Weighting |
checked |
|
Start Offset |
300 Hz |
|
Stop Offset |
3 kHz |
|
Data to Integrate |
Noise |
Click on the Integrate button and read the Residual FM value from under the Value of definite integral.
Enter the Residual FM value into the TME user interface for Residual FM and compare it to the specification.
Repeat steps 1 through 8 for each frequency test point through 3 GHz.
For test points > 3 GHz, a connection change is required.
Connect the UUT RF Output to the 1.2 GHz to 40 GHz Sig/RF Input of the M9550A Phase Detector module in the N5511A PNTS.
Connect the Reference Source Output to the 1.2 GHz to 40 GHz Ref/LO Input of the M9550A Phase Detector module in the N5511A PNTS.
Repeat steps 1 through 8 for each frequency test point > 3 GHz.
If testing an E4438C without Option UNJ:
Repeat steps 1 through 8 for each frequency test point in the table below.
|
Frequency (MHz) |
|
100 |
|
250.1 |
|
500 |
|
1000 |
|
2000 |
|
3000 |
|
4000 |
|
6000 |
Setup with a carrier frequency of 500 MHz
Connect all test equipment as shown.
Connect GPIB cables to all GPIB-controlled test equipment.
Preset all test equipment and the signal generator.
Connect the E8257D RF output to the N5500A reference input.
Connect the N5500A Tune Voltage Output to the E8257D Ext 1 input.
|
Table 1: E4438C and E4428C Carrier Test Frequencies and Power |
||
|
Frequency (MHz) |
DUT Power (dBm) |
Reference Power (dBm) |
|
100 |
14 |
12 |
|
250.1 |
14 |
12 |
|
500 |
14 |
12 |
|
1000 |
14 |
12 |
|
2000 |
10 |
5 |
|
3000 |
10 |
5 |
|
4000 |
10 |
5 |
|
6000 |
10 |
5 |
In the Keysight N5500A Phase Noise System user interface, change the following parameters:
Select the View pull down menu.
Select Display Preferences and clear the Spurs box.
Select OK to close Display Preferences.
From the System pull down menu, select Server Hardware Connections.
Ensure the correct FFT Analyzer is selected, either the 11 PCI20428W-1 or the 89410A.
Connect the signal generator's RF OUTPUT to the N5500A signal input.
From the Define pull down menu, select Measurement, and set the following:
|
Parameter |
Setting |
|
|
|
|
Type and Range Tab |
|
|
Measurement Type |
Absolute phase noise using phase lock loop |
|
Start Offset Frequency |
300 Hz |
|
Stop Offset Frequency |
3 kHz |
|
FFT Averages |
4 |
|
FFT Quality |
Normal |
|
Swept Quality |
Normal |
|
|
|
|
Sources Tab |
|
|
Carrier Source Connected |
Test Set |
|
Carrier Source Frequency |
See Table 1. |
|
Carrier Source Power |
See Table 1. |
|
Detector Input Frequency |
See Table 1. |
|
Reference Source Power |
See Table 1. |
|
Nominal Tune Constant |
1,000 Hz/Volt |
|
Tune Range |
5 volts for PSG |
|
Input Resistance |
50 ohms for PSG (600 ohms for 8665B) |
|
|
|
|
Cal Tab |
|
|
Measure Phase Detector Constant |
Checkmark |
|
Measure VCO Tune Constant |
Checkmark |
|
Verify calculated phase lock loop suppression |
Blank |
|
Phase Lock Loop Suppression |
Use theoretical value. |
|
|
|
|
Block Diagram Tab |
|
|
Carrier Source |
Manual |
|
Down Converter |
None |
|
Reference Source |
E8257D (or as configured) |
|
Phase Detector Mode |
Automatic Detector Selection |
|
Test Set Tune Voltage Destination |
Reference Source |
|
VCO Tune Mode |
DCFM |
|
|
|
|
Test Set Tab |
|
|
Input Attenuation |
0 dB |
|
LNA Low Pass Filter |
Auto |
|
LNA Gain |
Auto Gain |
|
PLL Integrator Attenuation |
0 dB |
|
|
|
|
Downconverter Tab |
|
|
Input Attenuation |
Auto |
|
IF Gain |
Auto |
|
Microwave/Millimeter Band |
Microwave (0 – 26.5 GHz) |
|
Reference Chain Reference |
10 MHz |
|
External Tune Enable |
Checkmark |
|
|
|
|
Graph Tab |
|
|
Title |
User specific |
|
Graph Type |
Spectral Density of Phase Fluctuations dB/Hz |
|
X Scale minimum |
300 Hz |
|
X Scale maximum |
3 kHz |
|
Y Scale maximum |
0 |
|
Y Scale minimum |
–170 |
|
Normalize Trace Data |
1 Hz bandwidth |
Set the signal generator frequency to the first carrier frequency and power in Table 1.
For the E4438C non-Option UNJ, set the Synthesizer Mode to the proper value for the test frequency being tested.
Frequency --> Optimize Φ Noise --> Mode 1 Optimize < 10 kHz Offset or Mode 2 Optimize > 10 kHz Offset
Set the RF Output to on.
Perform a phase noise measurement.
Place markers on the Sphi (f) plot at 300 Hz and 3 kHz. Enter these values into TME.
Left mouse click on the Analyze pull down menu and select Trace Integration.
|
Setup |
|
|
Parameter |
Setting |
|
Data Type |
Snu(f) (Spectral Density of Frequency Fluctuations) |
|
Start Offset |
300 Hz |
|
Stop Offset |
3 kHz |
|
CCITT Weighting |
Checkmarked |
|
Data to Integrate |
|
|
Noise |
Checkmarked |
Click on the Integrate field and read the Residual FM value from under the Value of definite integral.
Enter the Residual FM value into the TME user interface for Residual FM and compare it to the specification.
Continue to the next carrier setup and repeat the measurement. If the next carrier is > 1 GHz, then connect the reference generator signal to the 1.2 GHz to 26.5 GHz N5500A Reference input.
If testing a non-Option UNJ, then turn off the DUT Phase Noise Mode 1 and turn on Phase Noise Mode 2 and repeat steps 2 through 8 for each frequency in Table 1.
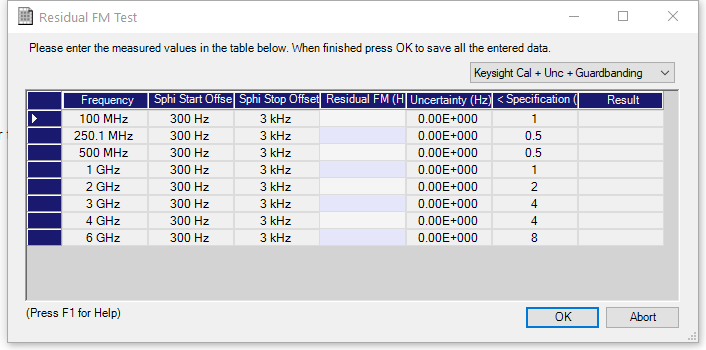
The measurement data must be entered into the following form displayed on-screen when the test is run.
Shown below is the input form for the E4438C without Option UNJ. (The E4428C and E4438C with Option UNJ form has fewer test points and has N/A for the Synthesizer Mode.)
Frequency and Synthesizer Mode columns:
E4438C (without Option UNJ): Frequency is paired with the synthesizer mode for testing.
E4428C or E4438C (Option UNJ): The frequency itself is the test point. There is no synthesizer mode for these DUTs.
Residual FM column
The measured Residual FM value from the phase noise test set system.
The 8902A measuring receiver measures the deviation (in Hz) of the residual FM. Because the display resolution of the measuring receiver is not high enough to discern low deviations (i.e., low residual FM), the FM deviation signal from the 8902A is passed along to an audio analyzer, where the AC level is measured.
The 8902A FM deviation output level is 1 mV per Hz of deviation.
The measuring receiver has an internal LO to down-convert the RF Input to its 1.5 MHz IF. Unfortunately, this internal LO does not have optimum phase noise for a residual FM measurement. For this test, the carrier signal is externally down-converted to 1.5 MHz and injected into the I.F. input of the measuring receiver.
|
Test Equipment |
Critical Specifications for This Test |
Recommended Models |
Alternate Models |
|
Measuring Receiver |
FM Demodulated Residual FM ≤ 0.1% |
8902A |
|
|
Audio Analyzer |
AC Level Accuracy: Display Resolution: 0.01 mV |
8903B Opt 011 or 051 |
|
|
Local Oscillator Not used for ESGs with frequency range < 3 GHz. |
Frequency Range: 100 to 6000 MHz Residual FM |
E8257D Opt UNR or UNX or UNY (Option 1EA or 1EU is not required, providing the LO in use has leveled output power at each test frequency.) |
E4428C Opt 503 or 506, |
|
Mixer |
RF/LO Freq. Range: 1 to 2800 MHz IF Frequency Range: 1.5 MHz |
0955-2225 |
M/A COM MDC-174 M/A COM MDC-1641
|
|
|
|
Measuring Receiver Calibration Setup
Residual FM Test Setup
In Case Of Difficulty
The actual Residual FM is the sum of the Residual FM in all components in the measurement system. Ensure that the local oscillator and measuring receiver are not contributing excessive Residual FM to the measurement. For example, make sure they are meeting their specifications.