M9484C with option ST5 or ST6
This manual test uses the N5511A Phase Noise Test System (PNTS) to verify that the M9484C VXG signal generator meets the single-sideband phase noise specifications.
The cross-correlation measurement method is used to test phase noise on the M9484C. The frequency test points being tested will determine the setup and test equipment required.
frequency test points from 2 GHz to 40 GHz — uses three different power dividers
frequency test points above 40 GHz — uses two external phase detectors along with a power divider
Using the cross-correlation method, the test system may achieve measurement sensitivity greater than the phase noise specifications of the reference sources as well as the single channel residual phase noise specification of the N5511A Phase Noise Test System (as specified in their respective datasheets). For an explanation as to why this can occur, ![]() click here.
click here.
|
Test Equipment |
Recommended Model |
Alternate Model |
|
Phase noise measurement system |
N5511A Options 540, CH2 |
None |
|
Phase noise reference source 1 |
E8257D1 Options 5xx2, UNT, UNY,1EU |
None |
|
Phase noise reference source 2 |
E8257D1 Options 5xx2, UNT, UNY,1EU |
None |
|
Low frequency power divider |
Mini-Circuits ZFSC-2-5-S+ |
None |
|
High frequency power divider |
87303C |
None |
|
mmWave power divider
|
Marki PD-0465 |
None |
|
mmWave phase detector
|
Marki MM1-2567LS |
None |
Select a frequency that is ≥ the maximum frequency of the DUT.
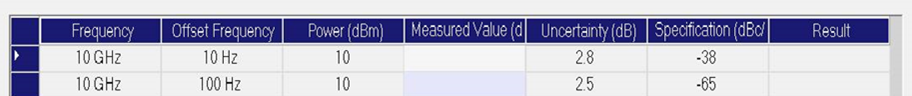
The values required for this test can be found on the TME data entry form. The form is generated in TME when the Single-Sideband Phase Noise test is started.
The table below explains the terms used in the test and their corresponding ![]() columns in the data entry form.
columns in the data entry form.
|
Test Value |
TME Data Entry Form Column Header |
|
Carrier (DUT) frequency |
Frequency |
|
Carrier (DUT) power |
Power (dBm) |
|
Measured offset frequencies |
Offset Frequency |
Click on the links below for the frequencies being tested.
This setup uses:
PNTS inputs 50 kHz to 3 GHz

This setup uses:
PNTS inputs 1.2 GHz to 40 GHz

For frequency options 532, 544, and 554.
This setup uses:
PNTS inputs 1.2 GHz to 40 GHz
For VXGs with frequency option 544 or 554.
This setup uses:
Marki PD-0465 power divider
Connect all test equipment as shown for Setup 1. There are a total of four different connection setups depending on the carrier frequencies being tested. These setup changes will be explained in steps 7, 8, and 9 in the Making the Measurement section.
Connect GPIB cables to all GPIB-controlled test equipment.
Preset all test equipment.
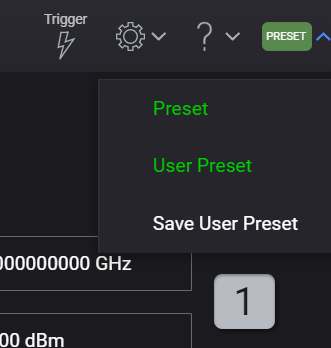
Preset the UUT. From the front panel, press the green PRESET button in the upper-right corner, then select Preset.
Obtain the TME data entry form. This form provides the values for the test which will be required later.
Launch TME with the UUT connected to the test system.
Start the Single-Sideband Phase Noise test. This will bring up the data entry form.
With the form selected, press Ctrl-A, Ctrl-C on the keyboard to collect the data in the form.
Open a text editor such as Microsoft Notepad and press Ctrl-V to copy the data entry form into this application.
Print out this data and use it to complete this test.
Configure the Phase Noise System:
In the N5510A PNTS user interface, change the following parameters:
Select the View pull-down menu.
Select Display Preferences and un-check the Spurs box.
Select OK to close Display Preferences.
Select the System pull-down menu and select Server Hardware Connections.
Select or ensure the following:
FFT Analyzer has Keysight M9551A selected.
Select Close to close Server Hardware Connections.
Select the Define pull-down menu, select Measurement, and select the following settings. Note that settings in bold differ from the preset values.
|
Parameter |
Setting |
|
Type and Range Tab: |
|
|
Measurement Type |
Absolute phase noise (using a phase locked loop) |
|
Measurement Method |
Fast |
|
Start Offset Resolution Expansion |
10 |
|
Channel Setup |
Dual |
|
Delay Before Measurement Initiates |
0 sec |
|
Start Offset Frequency |
0.7 Hz |
|
Stop Offset Frequency |
20 MHz (100 MHz carrier frequency) |
|
FFT Analyzer Minimum Number of Cross-correlations |
50 (Minimum. See notes on measurement settings.) |
|
RBW % |
7.84 (256 point FFT) |
|
FFT Overlap % |
75 |
|
FFT Window Type |
BlackmanHarris4 |
|
Couple Graph to Measurement Type |
Checked |
|
Uncorrected System Noise |
Unchecked (N5510 firmware revision 1.00.06.06 and later) |
|
Sources CH#1 Tab: |
|
|
Apply channel #1 parameters to channel #2 |
Checked |
|
Carrier Source Frequency |
Frequency test point value |
|
Carrier Source Power |
+10 dBm |
|
Detector Input Frequency |
Same as carrier source frequency |
|
Reference Source Power |
≤ 1 GHz: +15 dBm See notes on measurement settings. |
|
VCO Nominal Tune Constant |
Set to 0.1 ppm x Carrier source frequency For example, set to 1000 Hz/Volt for a carrier frequency of 10 GHz See notes on measurement settings. |
|
VCO Tune Range |
1 Volt |
|
VCO Input Resistance |
50 ohms |
|
Center Voltage |
0 |
|
Cal Ch#1 Tab: |
|
|
Apply channel #1 parameters to channel #2 |
Checked |
|
Phase Detector Constant |
Derive detector constant from measured beat note |
|
VCO Tune Constant |
Measure VCO tune constant |
|
Verify calculated phase lock loop suppression |
Unchecked |
|
Apply anti-correlation correction |
Unchecked |
|
Block Diagram Tab: |
|
|
Carrier Source |
Manual |
|
Use single reference source for both channels |
Unchecked |
|
Reference Source Channel #1 |
Asset name for reference source #1 |
|
Reference Source Channel #2 |
Asset name for reference source #2 |
|
Phase Detector |
Carrier frequencies < 40 GHz: Automatic Detector Selection |
|
Test Set Tune Voltage Output |
Front Panel |
|
Test Set Tune Voltage Destination |
Reference Source |
|
VCO Tune Mode |
DC FM |
|
Test Set Tab: |
|
|
LNA Low Pass Filter |
Internal — Selected Auto — Checked |
|
DC Block |
Unchecked |
|
LNA Gain |
Auto Gain — Selected |
|
PLL Integrator Attenuation |
0 dB |
|
Ignore out-of-lock conditions |
Unchecked |
|
Pulse Carrier |
Unchecked |
|
Graph Tab: |
|
|
Title |
User specific |
|
Graph Type |
Single-sideband phase noise (dBc/Hz) |
|
X Scale minimum |
1 Hz |
|
X Scale maximum |
100 MHz |
|
Y Scale maximum |
0 dBc/Hz |
|
Y Scale minimum |
–170 dBc/Hz |
|
Normalize Trace Data to |
1 Hz bandwidth |
|
Scale trace data to a new carrier frequency of |
1 times the current carrier frequency |
|
Shift trace data by |
0 dB |
|
Trace Smoothing Amount |
5 See notes on measurement settings. |
|
Power present of input of DUT |
0 dB |
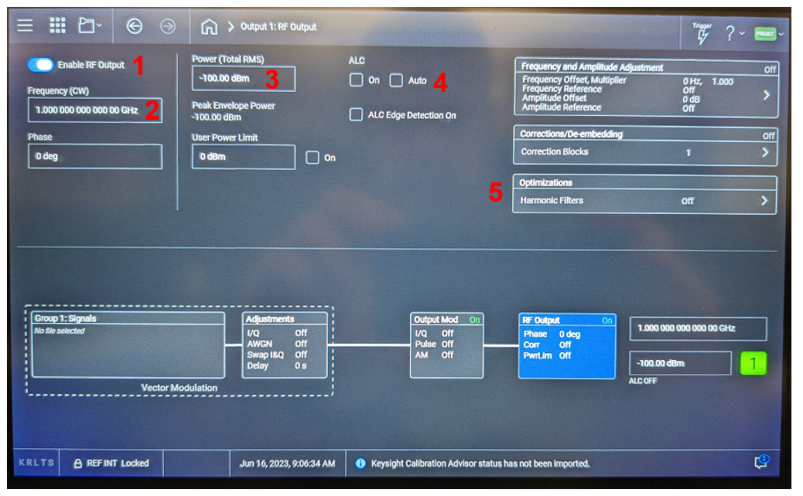
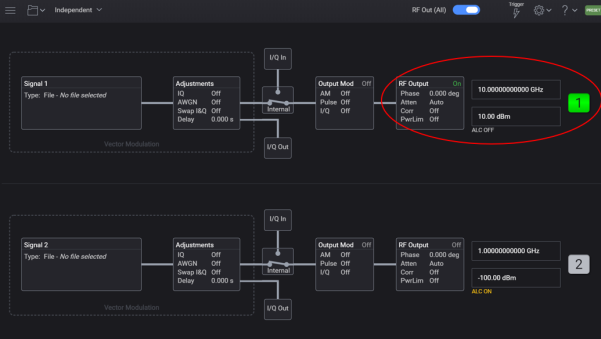
From the UUT front panel, set the UUT frequency and power to the first value in the TME data entry form. These settings are done within the RF Output dialog of the UUT.
Select the RF Output block for the channel being tested.
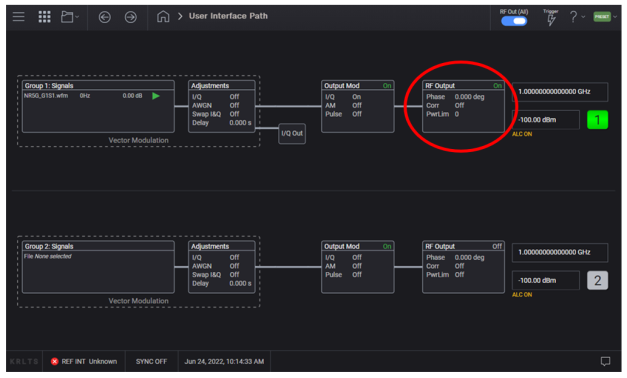
In the dialog box, make the following settings as shown in the image below.
Press the Home icon to save settings and close the dialog box.
Verify your settings in the main home screen.
Select the Measure pull-down menu and select New Measurement.
When the measurement completes, select the Markers icon and place markers at specified offsets to determine the measured phase noise. When specifying a marker offset, the marker will be set to the closest frequency on the graph as indicated in the following table:
|
Nominal Offset |
Actual Offset |
|
1 Hz |
1.0245 Hz |
|
10 Hz |
10.058 Hz |
|
100 Hz |
99.838 Hz |
|
1 kHz |
1.0014 kHz |
|
10 kHz |
9.9182 kHz |
|
100 kHz |
100.71 kHz |
|
1 MHz |
1.001 MHz |
|
10 MHz |
9.9609 MHz |
|
100 MHz |
100 MHz |
Transfer the marker amplitude values to the TME data entry form for the corresponding value of Frequency (carrier source frequency) and Offset Frequency (marker offset frequency).
Print out a phase noise plot.
Select the Measure pull-down menu and select New Measurement.
For carrier frequencies 2 GHz to 26.5 GHz, the following connection and settings changes are required:
Make the following change in Measurement Settings:
In the Sources CH#1 tab, change the Reference Source Power to +10 dBm. This is to avoid issues with the N5510A software when switching to the 1.2 GHz-to-40 GHz Inputs on the PNTS.
For carrier frequencies above 26.5 GHz to 40 GHz, make the following connection changes (VXGs with frequency options 532, 544 and 554):
Replace the Keysight power divider with the Marki PD-0465 mmWave power divider. Click here to go to connection image for Setup 3.
For carrier frequencies above 40 GHz, make the following connection and settings changes (VXGs with frequency options 544 and 554):
Make the following change in Measurement Settings:
In the Block Diagram tab, change Phase Detector to External Detector.
The effect of using cross-correlations is to remove the phase noise contributions of the reference sources and reduce the measurement variance due to noise. The default value should be sufficient in most cases, but in some circumstances based on the offset and relative phase noise performance of the reference sources compared to the UUT, it may be necessary to increase the number of cross-correlations to fully eliminate the noise bias and sufficiently reduce the noise variance. Increasing the number of cross-correlations will increase the measurement time.
If necessary due to cable loss and/or source power accuracy, adjust the source power so that a signal in the range of +10 to +16 dBm is delivered to the LO port of the phase detector.
VCO Tune Constant × VCO Tune Range sets the phase lock loop (PLL) bandwidth. A wider bandwidth makes it easier for the PNTS to automatically establish a beat note, but at the expense of higher close-in phase noise. Reducing the VCO Tune Constant may reduce the measured phase noise at the lower offsets, but this may require you to manually establish the beat note. Conversely if the measurement performance at low offsets is acceptable but you are having difficulty establishing the beat note, you may consider increasing this value.
Trace smoothing averages the measurement over adjacent points, reducing the variance due to noise. In some cases when there is a nearby spur, smoothing will artificially increase the measured value by including the spurious responses. In these circumstances it is acceptable to reduce the smoothing amount to exclude the spur.