Inst Spectrum (Digital Demod)
When is enabled, the (Instantaneous Spectrum) trace is the frequency spectrum of the pre-demodulated time data. The time data is windowed and passed through an FFT to create the display.
If is ON, spectrum trace data is the results of the pulse search. If averaging is on, the does not show the effects of averaging. To see the effects of averaging, use the Spectrum trace data.
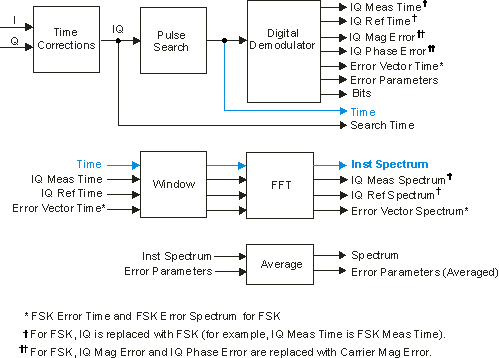
The following block diagram is part of the Digital Demodulation Block Diagram and shows how the is created.
The trace is derived from pre-demodulated time data, which is 20% longer than the .
See Also