Error Vector Spectrum (DOCSIS 4.0 Upstream)
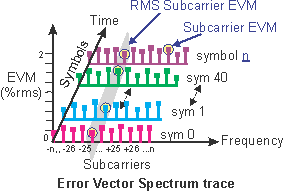
DOCSIS 4.0 Upstream trace shows the OFDM symbol and subcarrier Error Vector Magnitude (EVM) or Modulation Error Ratio (MER) vs. subcarrier (frequency) and Symbol (time). The Error Vector Spectrum trace allows you to easily attain information about the signal modulation quality as a function of the subcarriers.
Error Vector Spectrum trace provides the following data results: the subcarrier EVM and the RMS average subcarrier EVM. The trace analysis data includes preamble and payload data including all Preamble, Pilot, and Data subcarriers for the measurement burst. Unused subcarriers are blanked and not included in the measurement analysis. There is also a plot (default White line) of the RMS average subcarrier EVM for all subcarriers and symbols in the measurement analysis (Only visible for EVM, not MER).
This trace can be viewed in either MER or EVM mode (default is MER, Show MER on Error Vector Traces selected). It's often easier to see problems in EVM mode, because subcarriers with poor EVM spike up and stand out from the signal (as opposed to MER mode, where subcarriers with poor MER spike down and are easily lost in the signal).
When a marker is added to the trace, a banner of data appears at the top of the trace in green text. The marker results are described in the table below:
| Marker Results | Description |
|---|---|
|
specifies the marker subcarrier index. |
|
|
specifies the marker OFDM symbol number. |
|
|
This is the subcarrier EVM (%)/MER(dB) result for the marker subcarrier. |
|
|
This result is only available when showing EVM on traces. |
You can limit the number of symbols included in the measurement analysis data results using the Result Length, Measurement Interval, and Measurement Offset parameters.
Interpreting the Display
The y-axis ordinal is the MER magnitude (default is MER; deselect Show MER on Error Vector Traces to switch from MER to EVM), the x-axis ordinal is the subcarrier index, and the z-axis ordinal is the OFDM symbol. This trace format groups all symbols by subcarrier index for all the symbols within the measurement burst. For example; subcarrier index -10 shows subcarrier index -10 for all OFDM symbols in the measurement frame.

Trace Color coding Scheme
A multi-color coding scheme is used to make it easy to visually identify common symbols, subcarriers, and data results within various OFDM Traces. This makes cross trace data comparisons and analysis easy to accomplish. Different colors are assigned to symbols representing a common subcarrier type including: Pilot and Data subcarrier types. Some common color scheme Traces include: Error Vector Spectrum, Error Vector Time, and IQ Meas.
You can also customize and re-assign Trace colors schemes, see the Display Preferences Color tab (click tab and select a new color for the active Mod Type element).
See Also
