IQ (Polar) Diagrams (Trace Format)
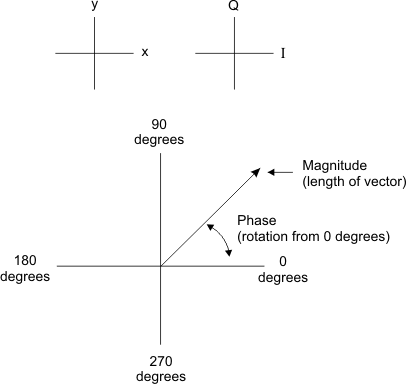
Selecting the trace format displays demodulated data using an IQ diagram (also called a polar or vector diagram). With an diagram, the VSA displays the in-phase signal (I) on the x-axis versus the quadrature-phase signal (Q) on the y-axis. The following information is provided:
- How Vector Magnitude is Determined
- Interpreting Marker Information
- Number of Display Points and Viewing the IQ Diagram
- Dots in the IQ Diagram
- Modifying Colors
How Vector Magnitude is Determined
Each point represents a vector: the magnitude of the vector is determined by the distance from the origin to the IQ point and the phase is determined by the angle of the vector counterclockwise from the positive x-axis, as shown below.
Interpreting Marker Information
Marker readouts show magnitude and phase or real and imaginary values. Markers hold their frequency (or time) position when changed between and other trace formats (except constellation diagrams that do not include sub-symbol samples).
To substitute real and imaginary values for magnitude and phase values in the marker readout, click and select Real & Imag for the Polar Format.
For diagrams, the first marker readout is the magnitude, the next readout is the phase. If the marker's Polar Format is , the first marker readout is the x (or I) value, the next readout is the y (or Q) value.
Number of Display Points and Viewing the IQ Diagram
For diagrams in Digital Demod, the number of display points per symbol is determined by the value of . For example, if the value of is 1, each display point corresponds to a symbol. If the value is 5, the 5th display point corresponds to a symbol¾in this case, the IQ diagram would show 4 display points between each symbol.
The effect of Points / Symbol can be seen by displaying the diagram and pressing an arrow key or turning the mouse wheel to move the marker between symbols. If the number of points per symbol is 5, moving the marker would reveal four distinct display points between symbols.
The trace format behaves like the trace format, except that the format ignores the setting and only displays the samples at the symbol locations (similar to = 1). See the Constellation Diagrams topic for more information.
only applies to Digital Demodulation.
Dots in the IQ Diagram
In an diagram, the symbols (detection decision-points) can be highlighted or unhighlighted. Set Symbol Shape to dots or bars to highlight the symbols. Or toggle symbol to none to remove any highlighting.
The number of symbols in the diagram is set by the Result Length (Digital Demod) or the Measurement Interval (W-CDMA Code Division Multiple Access: One of several digital wireless transmission methods in which signals are encoded using a specific pseudo-random sequence, or code, to define a communication channel. A receiver, knowing the code, can use it to decode the received signal in the presence of other signals in the channel. This is one of several "spread spectrum" techniques, which allows multiple users to share the same radio frequency spectrum by assigning each active user an unique code. CDMA offers improved spectral efficiency over analog transmission in that it allows for greater frequency reuse. Other characteristics of CDMA systems reduce dropped calls, increase battery life and offer more secure transmission. See also IS-95.(3GPP)/cdma2000).
Modifying Colors
The colors used can be modified to represent symbols. To do this, click , and click the tab. Then select the appropriate color-element and select the desired color.
|
To change this color: |
Modify these color elements: |
|---|---|
|
Symbol color |
Symbol |
| Annotation color | Trace |
| Marker color | Selected Marker, Not Selected Marker |
| Grid color | Grid |
See the Color Tab topic for more information.