About Time vs. Time Measurements
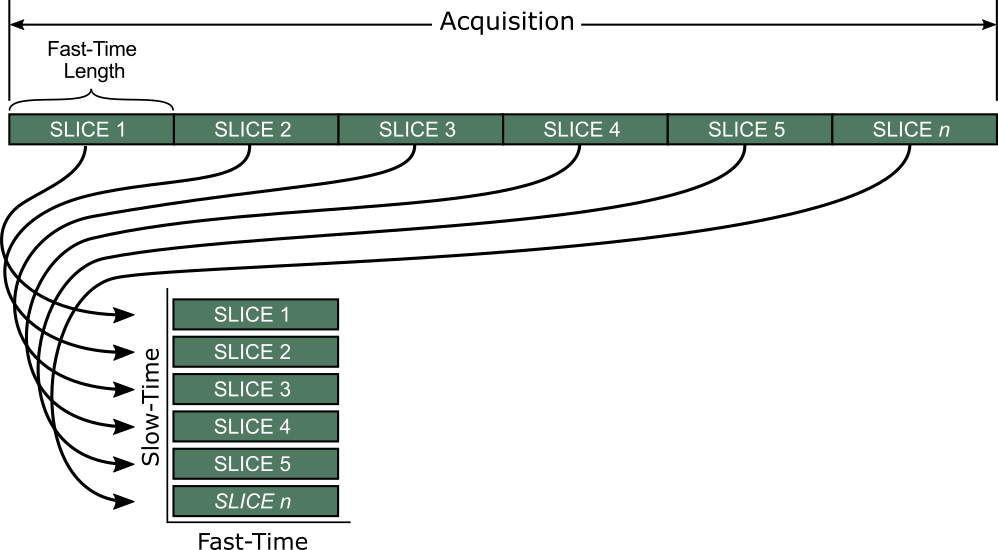
Time versus time measurements are based on the concept of Fast-Time Slow-Time data matrices commonly described in radar signal analysis. When a radar transmits a series of pulses in a coherent processing interval (CPI), the time vector of the acquired signal is chopped up into fast and slow time intervals. Fast-Time refers to the axis of fastest sampling rate, which in our case is the sampling rate of the VSA measurement. Assuming one fast-time data slice represents the time delta between two pulses (or pulse repetition interval), we can look at the time within a pulse. On the other hand, slow time increments by fast-time slices (typically the PRI) enabling a visualization of the evolution of the pulse over time. When the user inputs a Fast-Time Length, the slow-time length is automatically derived from capture length of the measurement.
The Time Versus Time measurements takes the current acquisition's time data, splits it into slices, and vertically stacks the slices into a 2-D matrix of power data.
There are three independent variables: fast-time, slow-time and power. These are represented in a Time v Time Heatmap, where the power is represented by color, enabling an excellent overview of the evolution of the radar signal with respect to slow-time. For Pulse measurements, the scan length (slice) should be set as close to the Pulse PRI as possible. If the pulse moves left or right relative to the fast time slice, the engineer can quickly detect any deviations from the intended pulse train with respect to the given PRI (or chosen slow-time demarcations).
Both the Time v Time Heatmap and Freq v Time Heatmap traces enable a quick view of a single acquisition of RF Radio Frequency: A generic term for radio-based technologies, operating between the Low Frequency range (30k Hz) and the Extra High Frequency range (300 GHz). IQ data. With every new acquisition, the old data is disposed.
See Also