PSD (Trace Data)
(Only available for measurement type)
shows the power spectral density (PSD Power Spectral Density: See power spectral density.) of the selected channel.
The definition of PSD yields y-axis units of Vpk^2/Hz and x-axis units of frequency as shown in the following illustration:
|... Vpk^2 | .. ----- | ..... Hz | . | .......... |_____________________ Frequency |
PSD is used for noise measurements. It shows the power density of a signal as a function of frequency. In general, noise may have any arbitrary frequency content, resulting in a variety of possible PSD shapes. Noise that has equal power density at all frequencies is called white noise as shown in the following illustration:
| White Noise Vpk^2 | ----- |..................... Hz | | |_____________________ Frequency |
The definition of PSD is power per Hertz. In other words, power is divided by the measurement bandwidth. The measurement bandwidth in the 89600 VSA is the resolution bandwidth (ResBW). The definition of PSD is as follows:
![]()
Units of Vpk^2/Hz assumes the signal is referenced to 1 ohm. That is, because no resistance is specified, the signal is interpreted as a voltage across a one ohm resistor, with the power in the resistor equal to Vpk^2.
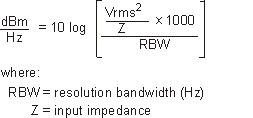
Units of dBm deciBels referenced to a milliWatt: dB relative to 1 milliwatt dissipated in the nominal input impedance of the analyzer/Hz can be selected by setting the Trace Format to to take into account the measurement hardware's input impedance. PSD defaults to these units. The VSA calculates dBm/Hz as follows: