Windowing Frequency Response
The 89600 VSA functions as if the input signal were applied to a parallel bank of narrow-band filters (the number corresponding to the number of frequency points). The illustrations below show the frequency-domain response of a single filter when using one of the available VSA windows. Click one of the windows in the following list to jump to that window:
To learn more about Windowing concepts, see Windowing in the VSA Concepts help.
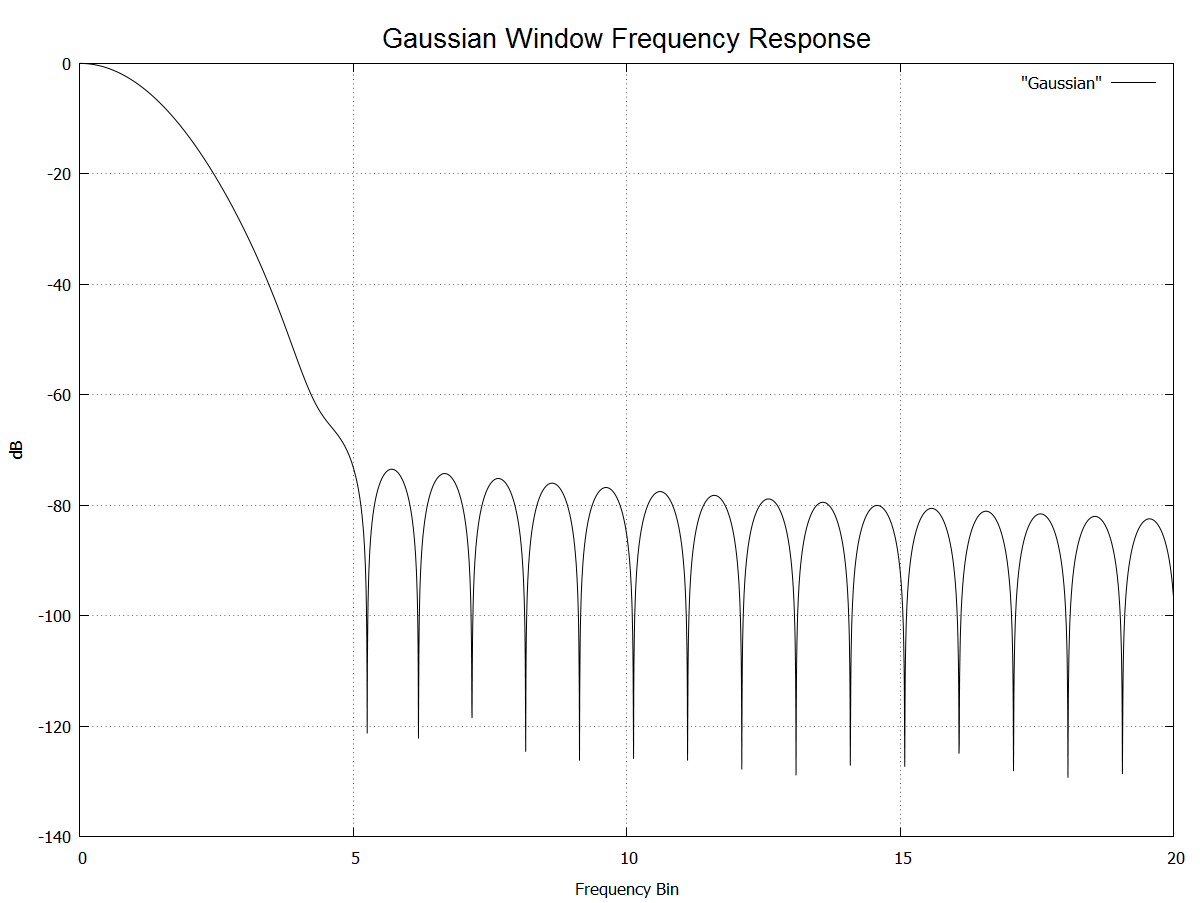
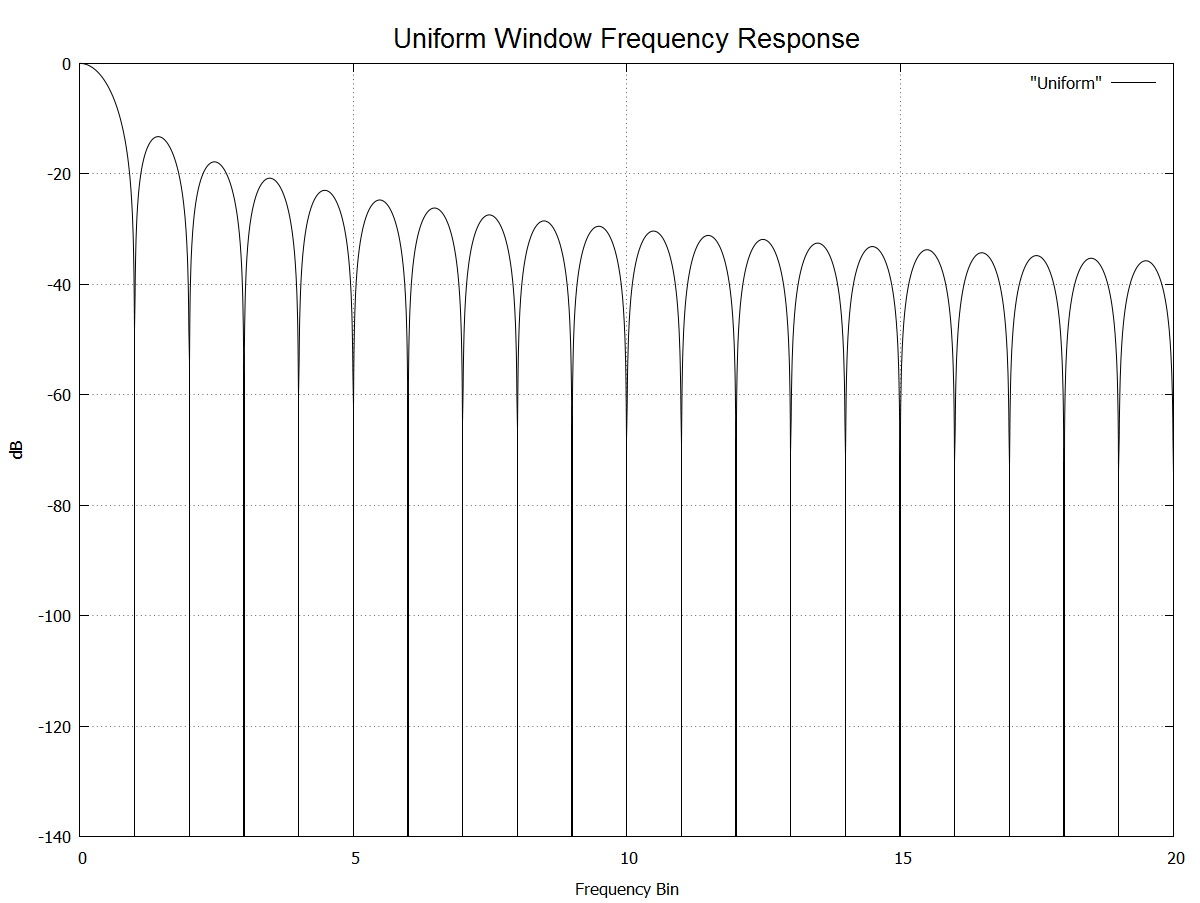
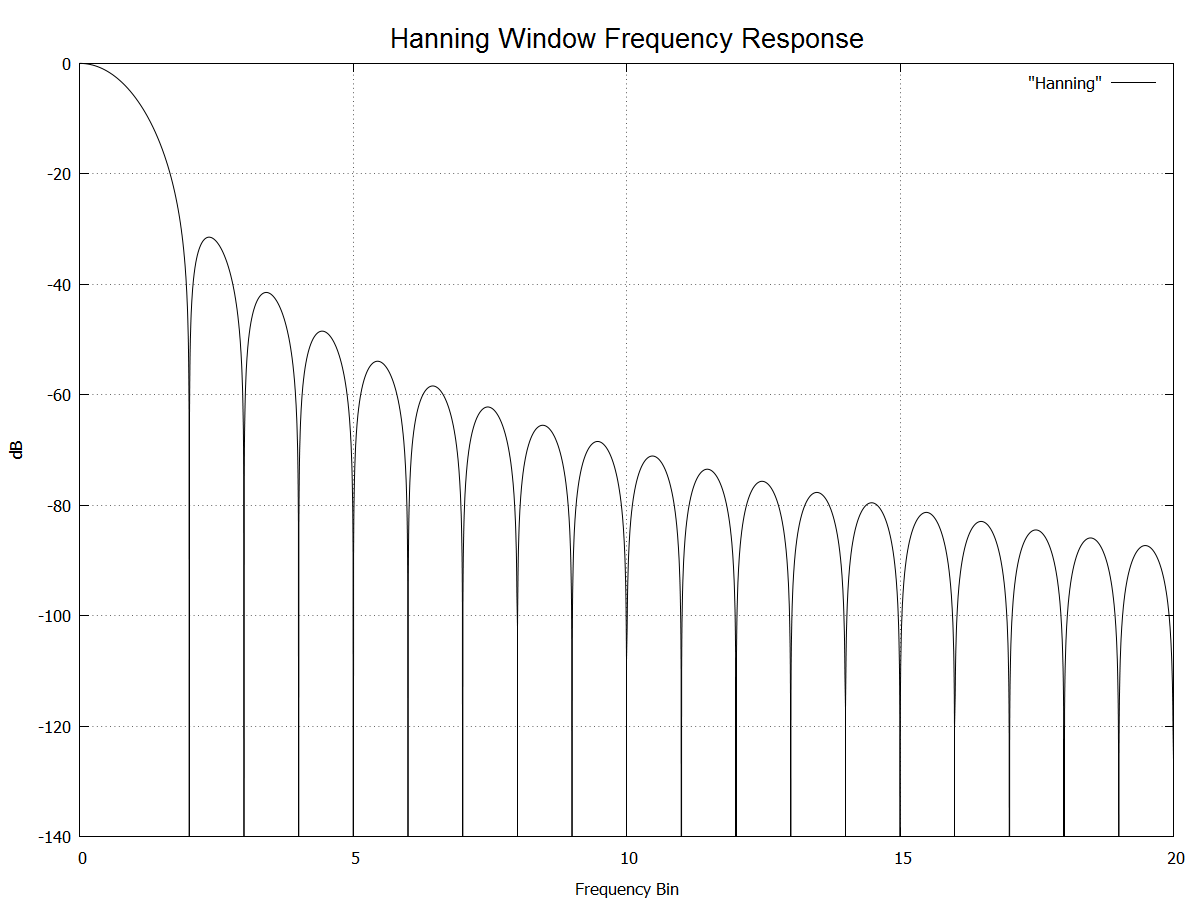
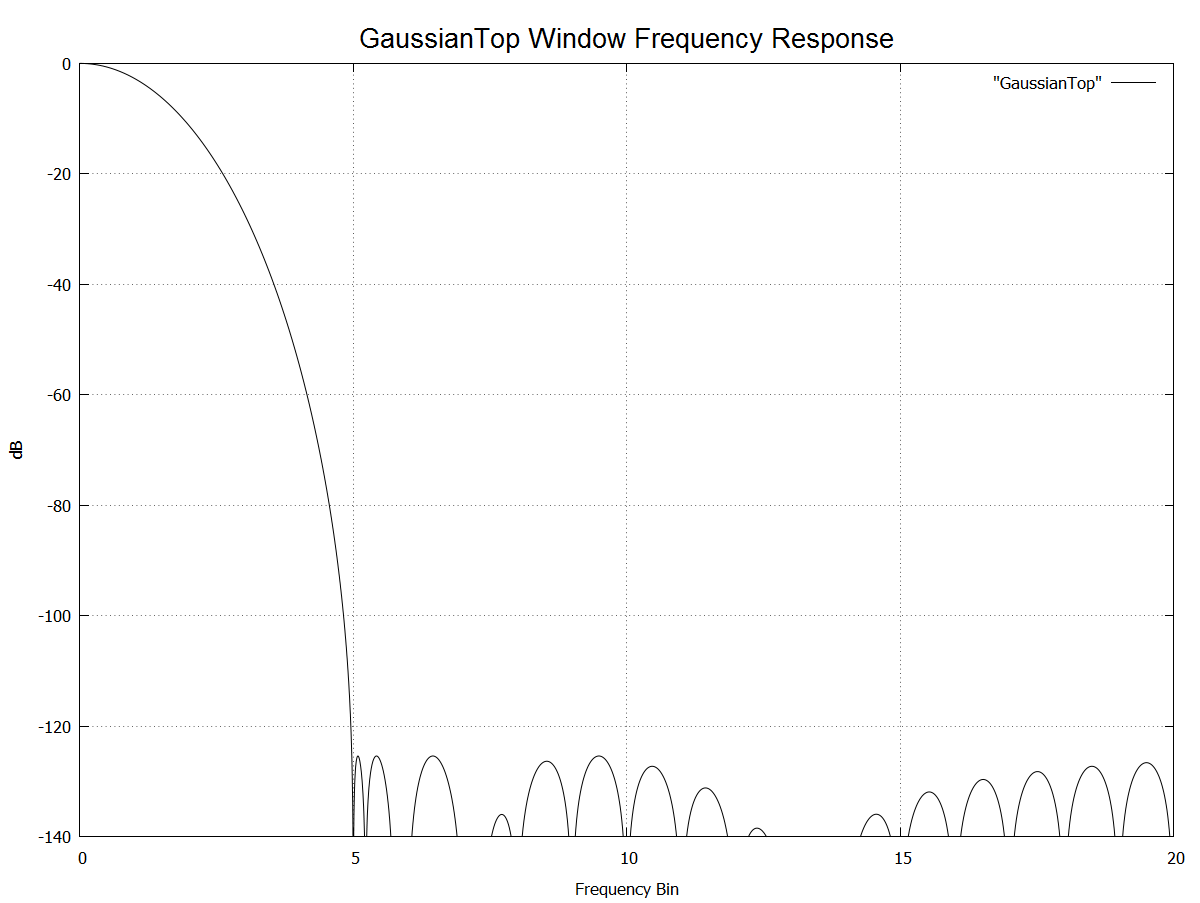
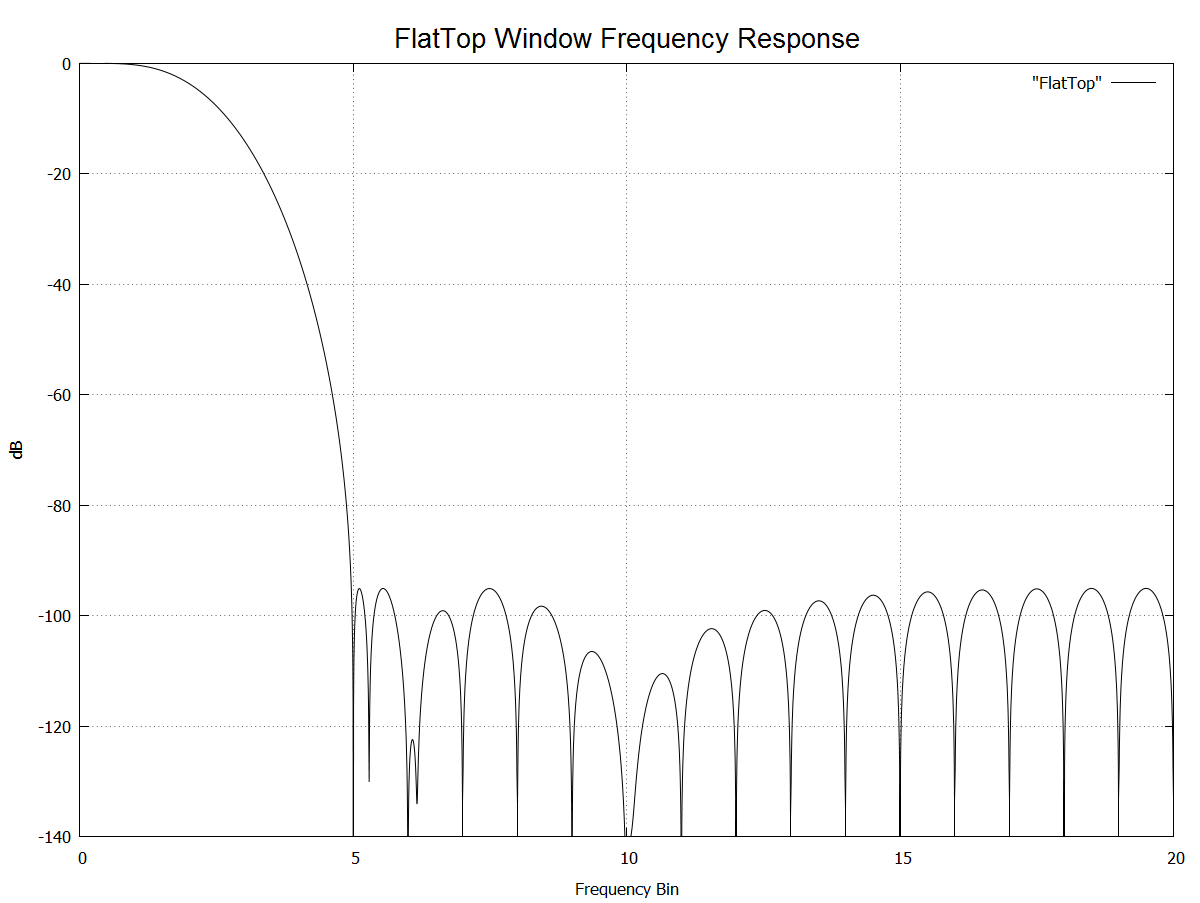
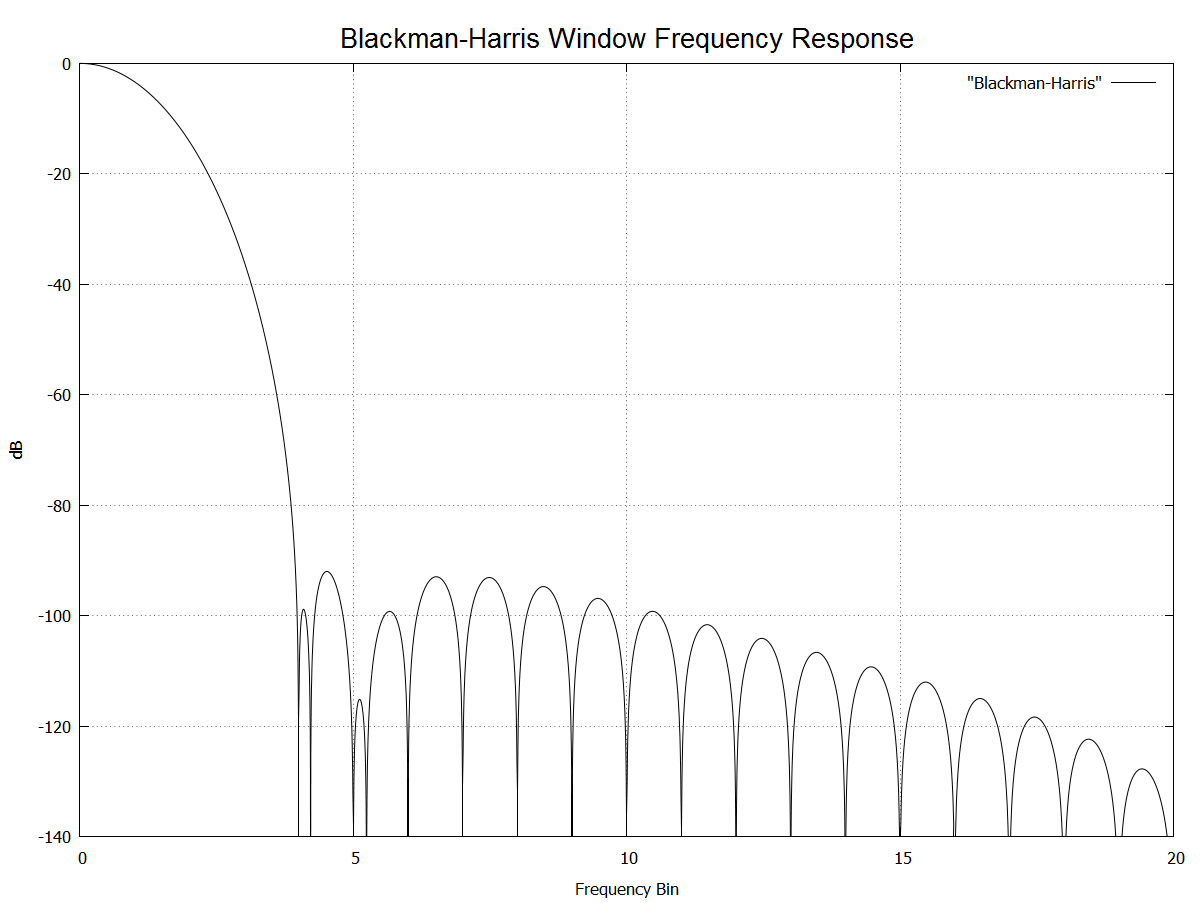
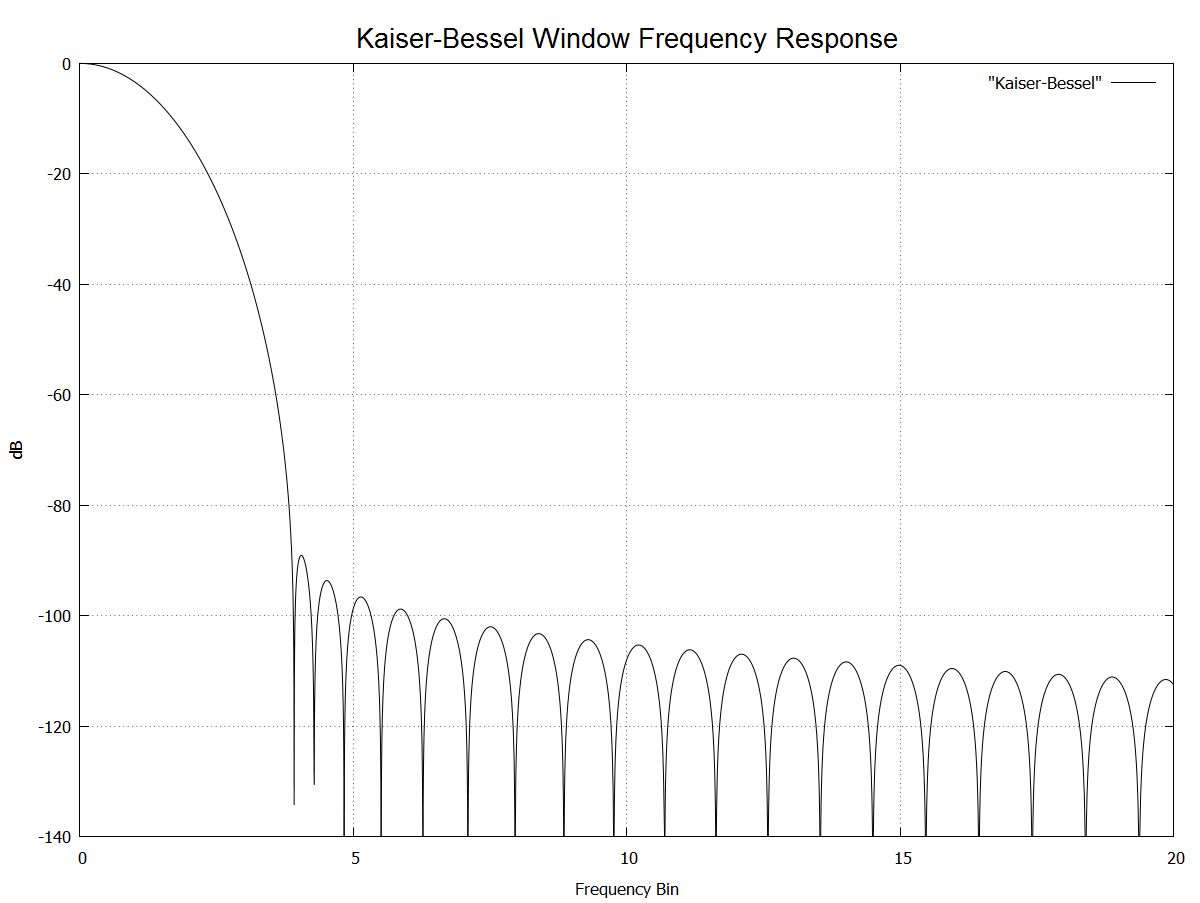
The left side of each illustration represents the center of each filter. Because the filters are symmetrical, we've shown only one side of each filter response (the other side is a mirror image). The horizontal axis is normalized to 1/T where T is the length of the window.
Think of each drawing as a template. If a sine frequency is positioned at the exact center of the filter, more of a sine wave's energy appears in the center bin. Some of its energy also appears in other bins. The amount of energy that spills into adjacent bins depends on the type of window used. Frequency resolution is determined by the width of the main lobe. The window provides better frequency resolution for a fixed time record length while the window has good frequency resolution for a fixed resolution bandwidth.
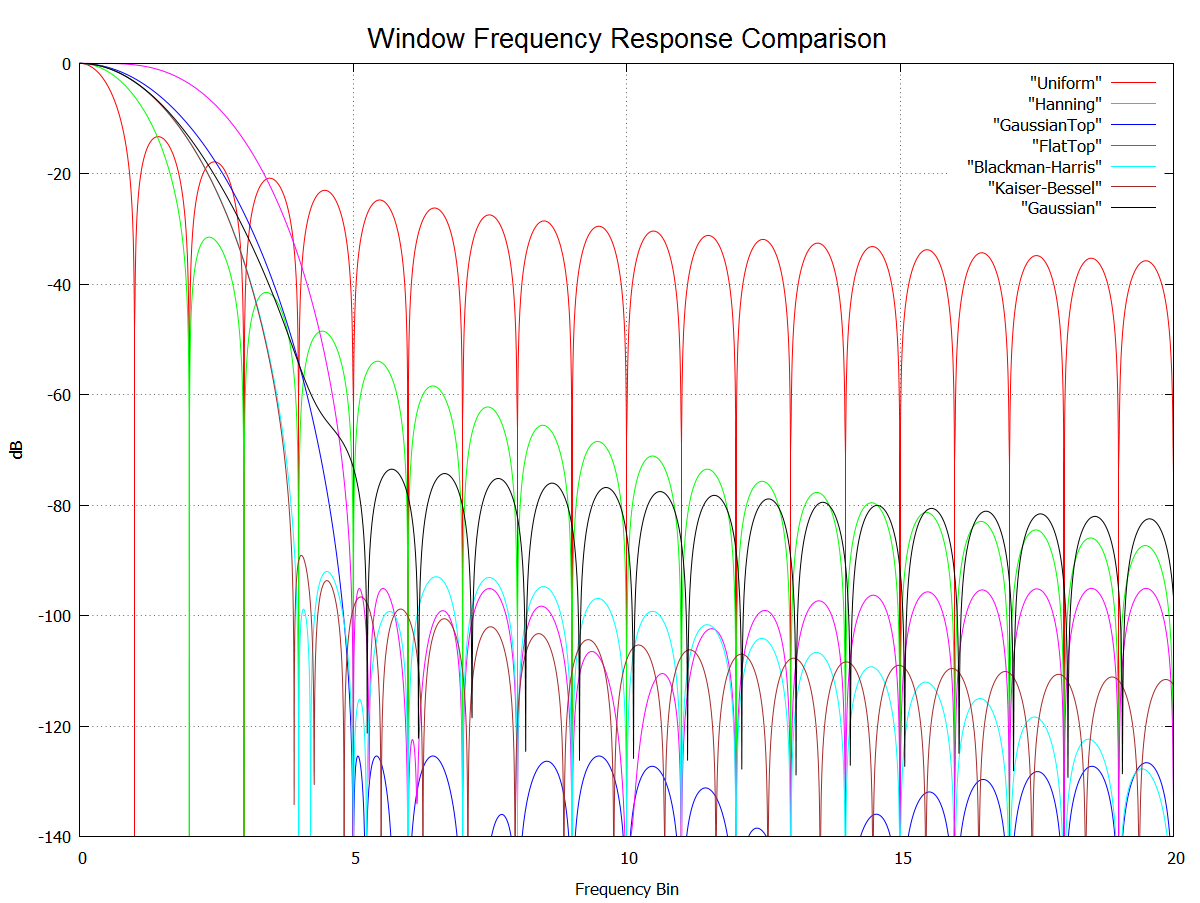
Window Comparison (for the same time-record length)
Uniform Window
Hanning Window
Gaussian Top Window
Flat Top Window
Blackman-Harris Window
Kaiser-Bessel Window
Gaussian Window