Error Vector Time (802.11a/g/j/p OFDM)
trace data shows the OFDM Orthogonal Frequency Division Multiplexing: OFDM employs multiple overlapping radio frequency carriers, each operating at a carefully chosen frequency that is Orthogonal to the others, to produce a transmission scheme that supports higher bit rates due to parallel channel operation. OFDM is an alternative tranmission scheme to DSSS and FHSS. symbol and subcarrier EVM Error vector magnitude (EVM): A quality metric in digital communication systems. See the EVM metric in the Error Summary Table topic in each demodulator for more information on how EVM is calculated for that modulation format. vs. symbol (frequency) and subcarrier (Time). There is a separate trace for each measurement channel and spatial stream (MIMO Multiple Input, Multiple Output: A physical layer (PHY) configuration in which both transmitter and receiver use multiple antennas. only). The Error Vector Time trace enables you to easily attain information about the signal modulation quality as a function of the OFDM symbols.
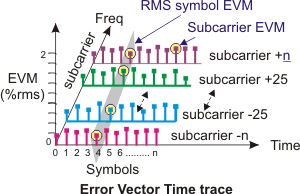
The Error Vector Time trace provides the following data results: the subcarrier EVM and the RMS average symbol EVM. The trace analysis data includes the payload data symbols including all Pilot and Data subcarriers for the measurement burst. Unused subcarriers are blanked and not included in the measurement analysis. There is also a plot (white line) of the RMS average EVM at each symbol-time (includes all 52 subcarriers at that symbol-time).
| Marker Results | Description |
|---|---|
| specifies the marker OFDM symbol number. | |
| specifies the marker subcarrier index. | |
| This is the subcarrier EVM (%) result for the marker subcarrier. Subcarrier EVM is the EVM between the measured (IQ Meas) subcarrier vector and an ideal (IQ Ref) subcarrier vector. |
|
| This is the RMS symbol EVM (m%) result for the marker symbol. RMS Symbol EVM is the computed RMS average of the subcarrier-symbol EVMs for a particular OFDM symbol for all symbols within the measurement analysis region, see RMS Error Vector Time. |
You can limit the number of symbols included in the measurement analysis data results using the Result Length (Automatic),, Result Length (Manual), Measurement Interval, and Measurement Offset parameters.
Carrier phase drift will show up in the Error Vector Time trace, and not in the Common Pilot Error trace when Track Phase is cleared. Carrier phase drift will show up in the Common Pilot Error trace, but will be mostly removed from the Error Vector Time trace when Track Phase is selected.
Interpreting the Display
The y-axis ordinal is the EVM magnitude, the x-axis ordinal is the OFDM symbol number, and the z-axis ordinal is the subcarrier index. This trace format groups subcarriers by symbol for all the symbols within the measurement burst. For example; symbol 2 shows all subcarriers associated with symbol 2.
The trace data uses a multi-color display that assigns a unique color to the pilot subcarriers, the data subcarriers.
Trace Color coding Scheme
A multi-color coding scheme is used to make it easy to visually identify common symbols, subcarriers, and data results within various OFDM Traces. This makes cross trace data comparisons and analysis easy to accomplish. Different colors are assigned to symbols representing a common subcarrier type including: Pilot and Data subcarrier types. Some common color scheme Traces include: Error Vector Spectrum, Error Vector Time, IQ Meas, IQ Ref, and the Syms/Errs trace data.
You can also customize and re-assign Trace colors schemes, see the Display Preferences Color tab (click tab and select a new color for the active Mod Type element).
See Also