Gated FFT Concepts |
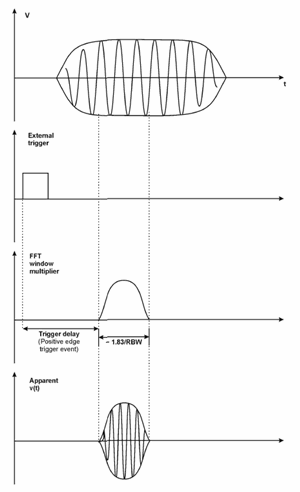
Gated FFT (Fast-Fourier Transform) is an FFT measurement which begins when the trigger conditions are satisfied.
The process of making a spectrum measurement with FFTs is inherently a “gated” process, in that the spectrum is computed from a time record of short duration, much like a gate signal in swept-gated analysis.
Using the FieldFox in FFT mode, the duration of the time record to be gated is:
FFT Time Record to be gated = 1.83/RBW
The duration of the time record is within a tolerance of approximately 3% for resolution bandwidths up through 1 MHz. Unlike swept gated analysis, the duration of the analysis in gated FFT is fixed by the RBW, not by the gate signal.
Because FFT analysis is faster than swept analysis (up to 10 MHz), the gated FFT measurements can have better frequency resolution (a narrower RBW) than swept analysis for a given duration of the signal to be analyzed.

The gate passes or blocks a signal with the following conditions:
Trigger condition - Usually an external transistor-transistor logic (TTL) periodic signal for edge triggering and a high/low TTL signal for level triggering.
Gate delay - The time after the trigger condition is met when the gate will pass a signal (for edge triggering).
Gate length - The gate length setting determines the length of time a gate will pass a signal for edge triggering.
To understand time gating better, consider a spectrum measurement performed on two pulsed-RF signals sharing the same frequency spectrum. You will need to consider the timing interaction of three signals with this example:
The composite of the two pulsed-RF signals.
The gate trigger signal (a periodic TTL level signal).
The gate signal. This TTL signal is low when the gate is "off" (blocking) and high when the gate is "on" (passing).
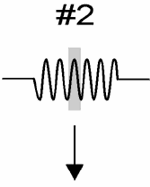
The timing interactions between the three signals are best understood if you observe them in the time domain. See Figure 2. The main goal is to measure the spectrum of signal 1 and determine if it has any low-level modulation or spurious signals. Because the pulse trains of signal 1 and signal 2 have almost the same carrier frequency, their spectra overlap. Signal 2 will dominate in the frequency domain due to its greater amplitude. Without gating, you won't see the spectrum of signal 1; it is masked by signal 2.
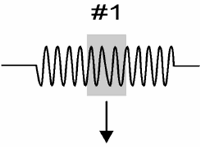
To measure signal 1, the gate must be on only during the pulses from signal 1. The gate will be off at all other times, thus excluding all other signals. To position the gate, set the gate delay and gate length, as shown in See Figure 2 so that the gate is on only during some central part of the pulse. Carefully avoid positioning the gate over the rising or falling pulse edges. When gating is activated, the gate output signal will indicate actual gate position in time, as shown in the line labeled "Gate."
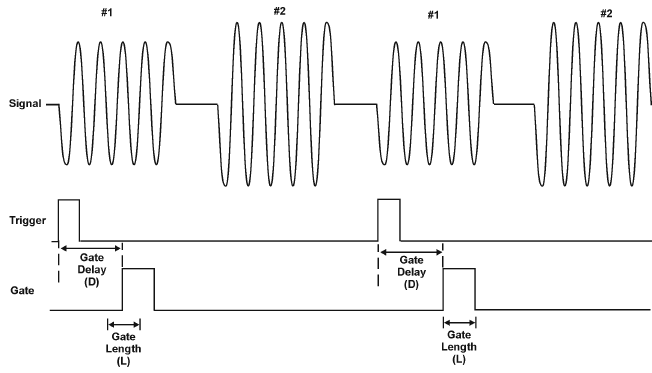
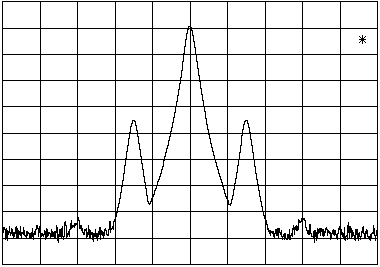
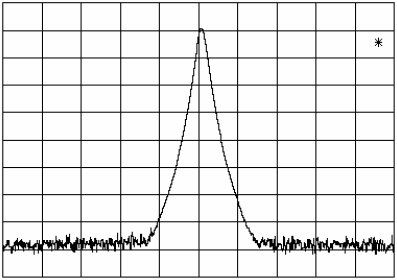
Once the spectrum analyzer is set up to perform the gate measurement, the spectrum of signal 1 is visible and the spectrum of signal 2 is
excluded, as shown if Figure 15-12. In addition, when viewing signal 1,
you also will have eliminated the pulse spectrum generated from the
pulse edges. Gating has allowed you to view spectral components that
otherwise would be hidden.
NOTE The steps below help to determine the spectrum analyzer settings when using time gating. The steps apply to the time gating approaches using gated LO on the PSA and gated video on the ESA.
This example shows you how to use time gating to measure a very specific signal. Most signals requiring time gating are fairly complex and in some cases extra steps may be required to perform a measurement.
Step 1. Determine how your signal under test appears in the time domain and how it is synchronized to the trigger signal.
You need to do this to position the time gate by setting the delay relative to the trigger signal. To set the delay, you need to know the timing relationship between the trigger and the signal under test.
Unless you already have a good idea of how the two signals look in the time domain, you can examine the signals with an oscilloscope to determine the following parameters:
Trigger type (edge or level triggering)
Pulse repetition interval (PRI), which is the length of time between trigger events (the trigger period).
Pulse width
Signal delay (SD), which is the length of time occurring between the trigger event and when the signal is present and stable. If your trigger occurs at the same time as the signal, signal delay will be zero.
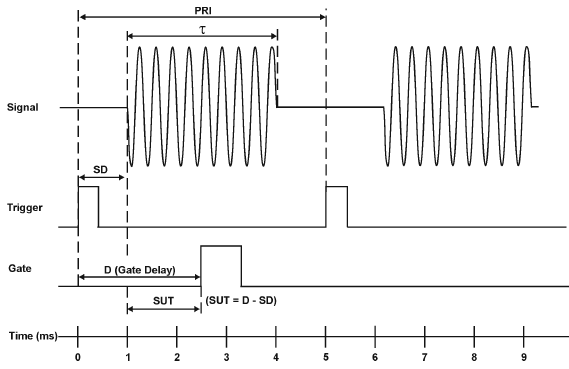
In Figure 3 the parameters are:
• Pulse repetition interval (PRI) is 5 ms.
• Pulse width (ô) is 3 ms.
• Signal delay (SD) is 1 ms for positive edge trigger (0.8 ms for negative edge trigger).
• Gate delay (D) is 2.5 ms.
• Setup time (SUT) is 1.5 ms.
Step 2. Set the spectrum analyzer sweep time:
PSA: Sweep time does not affect the results of gated LO unless the sweep time is set too fast. In the event the sweep time is set too fast, Meas Uncal appears on the screen and the sweep time will need to be increased.
ESA: Sweep time does affect the results from gated video. The sweep time must be set accordingly for correct time gating results. The sweep time should be set to at least the number of sweep points - 1 multiplied by the PRI (pulse repetition interval).
Step 3. Locate the signal under test on the display of the spectrum analyzer. Set the center frequency and span to view the signal characteristics that you are interested in measuring. Although the analyzer is not yet configured for correct gated measurements, you will want to determine the approximate frequency and span in which to display the signal of interest. If the signal is erratic or intermittent, you may want to hold the maximum value of the signal with Max Hold to determine the frequency of peak energy.
To optimize measurement speed, set the span narrow enough so that the display will still show the signal characteristics you want to measure. For example, if you wanted to look for spurious signals within a 200 kHz frequency range, you might set the frequency span to just over 200 kHz.
Step 4. Determine the setup time and signal delay to set up the gate signal. Turn on the gate and adjust the gate parameters including gate delay and gate length as shown below.
Generally, the gate should be positioned over a part of the signal that is stable, not over a pulse edge or other transition that might disturb the spectrum. Starting the gate at the center of the pulse gives a setup time of about half the pulse width. Setup time describes the length of time during which that signal is present and stable before the gate comes on. The setup time (SUT) must be adequately long enough for the RBW filters to settle following the burst-on transients. Signal delay (SD) is the length of time after the trigger, but before the signal of interest occurs and becomes stable. If the trigger occurs simultaneously with the signal of interest, SD is equal to zero, and SUT is equal to the gate delay. Otherwise, SUT is equal to the gate delay minus SD. See Figure 4.
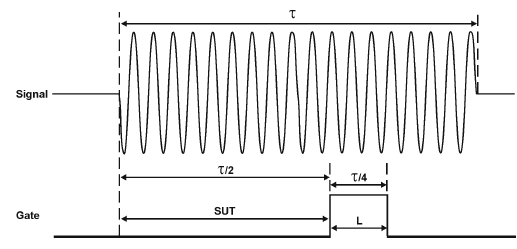
There is flexibility in positioning the gate, but some positions offer a wider choice of resolution bandwidths. A good rule of thumb is to position the gate from 20% to 80% of the burst for PSA, and 25% to 80% of the burst for ESA. Doing so provides a reasonable compromise between setup time and gate length.

As a general rule, you will obtain the best measurement results if you position the gate relatively late within the signal of interest, but without extending the gate over the trailing pulse edge or signal transition. Doing so maximizes setup time and provides the resolution bandwidth filters of the spectrum analyzer the most time to settle before a gated measurement is made. "Relatively late," in this case, means allowing a setup time of approximately 2 divided by the resolution bandwidth (see step 5 for RBW calculations).
As an example, if you want to use a 1 kHz resolution bandwidth for measurements, you will need to allow a setup time of at least 2 ms.
Note that the signal need not be an RF pulse. It could be simply a particular period of modulation in a signal that is continuously operating at full power, or it could even be during the off time between pulses. Depending on your specific application, adjust the gate position to allow for progressively longer setup times (ensuring that the gate is not left on over another signal change such as a pulse edge or transient), and select the gate delay and length that offer the best signal-to-noise ratio on the display.
If you were measuring the spectrum occurring between pulses, you should use the same (or longer) setup time after the pulse goes away, but before the gate goes on. This lets the resolution bandwidth filters fully discharge the large pulse before the measurement is made on the low-level interpulse signal.
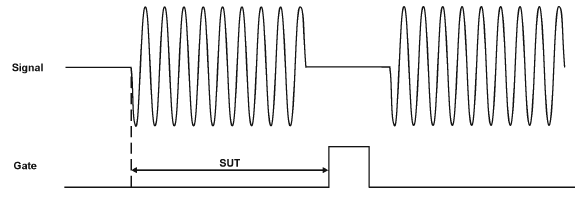
Step 5. The resolution bandwidth will need to be adjusted for gated LO and gated video. The video bandwidth will only need to be adjusted for gated video.
The resolution bandwidth you can choose is determined by the gate position, so you can trade off longer setup times for narrower resolution bandwidths. This trade-off is due to the time required for the resolution-bandwidth filters to fully charge before the gate comes on. Setup time, as mentioned, is the length of time that the signal is present and stable before the gate comes on.
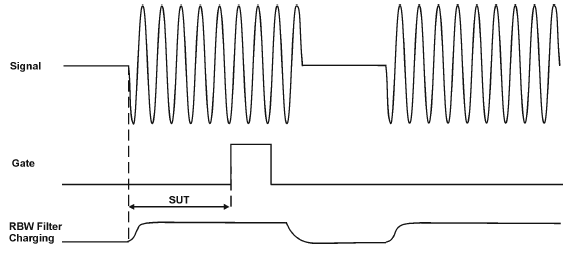
Because the resolution-bandwidth filters are band-limited devices, they require a finite amount of time to react to changing conditions. Specifically, the filters take time to charge fully after the analyzer is exposed to a pulsed signal.
Because setup time should be greater than filter charge times, be sure (PICK ONE)

where SUT is the same as the gate delay in this example. In this example with SUT equal to 1.5 ms, for ESA, RBW is greater than 2/1.5 ms; that is, RBW is greater than 1333 Hz. The resolution bandwidth should be set to the next larger value, 3 kHz.
Just as the resolution bandwidth filter needs a finite amount of time to charge and discharge, so does the video filter, which is a post-detection filter used mainly to smooth the measurement trace. Regardless of the length of the real RF pulse, the video filter sees a pulse no longer than the gate length, and the filter will spend part of that time charging up.
Reducing the video-bandwidth filter too fast causes the signal to appear to drop in amplitude on the screen.
If you are in doubt about the proper video bandwidth to choose, set it to its maximum and reduce it gradually until the detected signal level drops slightly. Then reset it to the value it was at just before the signal dropped.
Leave both RBW and VBW in the manual mode, not Auto. This is important so that they will not change if the span is changed. The setting readout on the bottom line of the analyzer screen should show a "#" sign next to the function names (for example, #Res BW, #VBW, and #Sweep), indicating that they have been set manually.
Setting the ESA VBW: - To ensure that a true peak value is obtained before the gate goes off, the video filter must have a charge time of less than the gate length. For this purpose, you can approximate the charge time of the video filter as 1/VBW, where VBW is the -3 dB bandwidth of the video filter. Therefore, you will want to be sure that gate length > 1/VBW.
For example, if you use a 1 kHz video bandwidth for noise smoothing, you need a gate length greater than 1 ms. Alternatively, if you use a gate as narrow as 1 ìs, you should use a video filter of 1 MHz.
Setting the PSA VBW: For gated LO measurements the VBW filter acts as a track-and-hold between sweep times. With this behavior, the VBW does not need to resettle on each restart of the sweep.
Step 6. Adjust span as necessary, and perform your measurement.
The analyzer is set up to perform accurate measurements. Freeze the trace data by activating single sweep, or by placing your active trace in view mode. Use the markers to measure the signal parameters you chose in step 1. If necessary, adjust span, but do not decrease resolution bandwidth, video bandwidth, or sweep time.
There is much more in the E4401-90482 manual. Page 147 and on.
Last Modified: