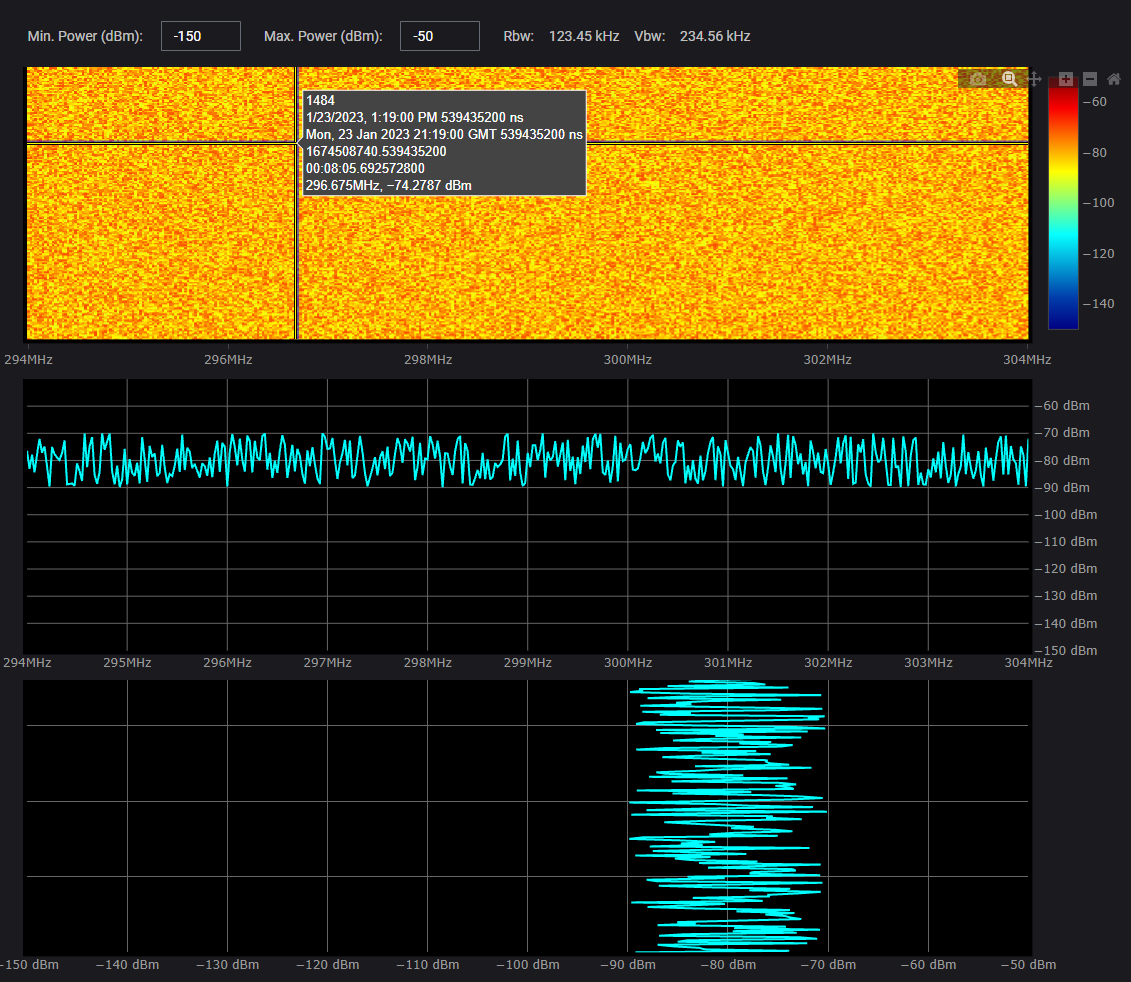
Spectrum Cross Domain graph shows a single receiver measurement composite of the following:
Spectrogram display - Spectrogram provides a visual history of the measured spectrum. This display type can be used to locate intermittent signals or to view signal levels and frequencies over time.
Spectrum display - This is the spectrum power display.
Power vs. Time display - This displays a specific time section of the spectrogram in time vs. power graph.
Learn more, see Monitor (Spectrum) UI - Overview and Monitor (Occupancy) UI - Overview.
Cross Domain Display and Using Mouse to Select a Frequency to Measure