You can generate a PDF or HTML report that includes trace charts and data table for each measurement trace and channel. The HTML output allows a portable measurement report that can be opened and viewed in a browser.
Beginning with Rev. 2016, frequency units are selectable.
Beginning with Rev. 2018, data can be organized by channel or by plot, includes define measurement parameters, software information, limit test result and marker information for plot report, and generate a report in PDF or html format (PDF only for Organize by Plot).
Beginning with Rev. 2020, Shade and Ubars have been added.
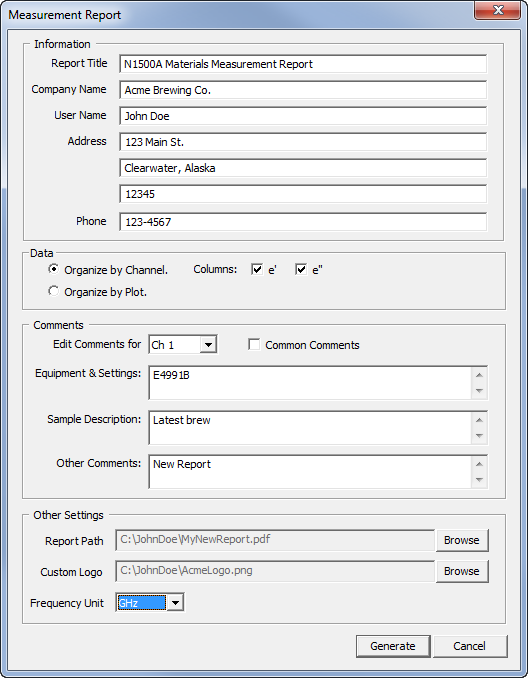
Click File, then Measurement Report
The above settings yield a first page along with trace charts and data table for each measurement trace and channel:
Last modified:
22-Apr-2020 |
Updated Measurement Report dialog to include Shade and Ubars |
26-Jan-2016 |
Added HTML reports |
5-Mar-2015 |
Updated for Keysight |
6-Sep-2013 |
New topic |