This example shows how to use the Equation feature in PLTS to create a phase and unwrapped phase trace.
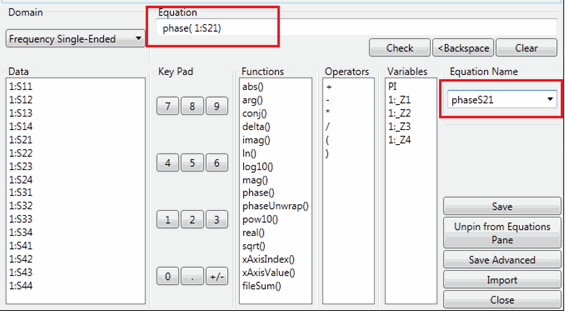
1. Define an equation named “phaseS21”. The definition is “phase(1:S21)”

2. Apply it to a "frequency: single-ended" plot.
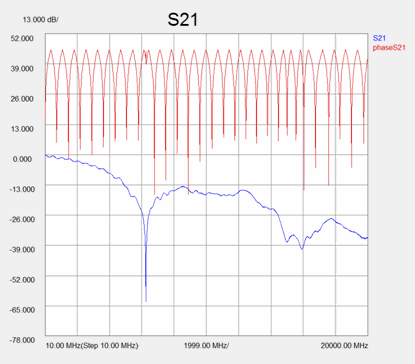
In the picture below, the red trace is the equation result. But it looks strange because the plot is in “Log Mag” display format, which means the trace actually is the logarithm of phase of S21. In other words, you are looking at: Log ( Mag ( phase(1:S21) )
3. Change the display format to “Real”, and “Auto Scale” the plot. Now you are looking a phase(1:S21)
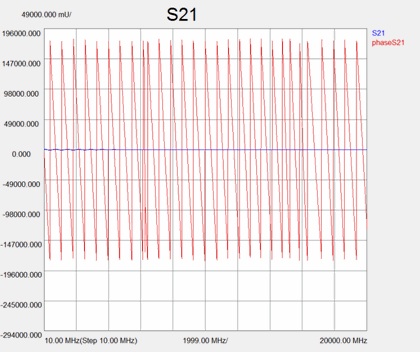
4. Change the display format to “Phase”, and “Auto Scale” again.
In the picture below, the blue trace is S21 displayed in “Phase” format with display units mU, where 1 U equals 1 degree. The display units of the red trace is degrees.
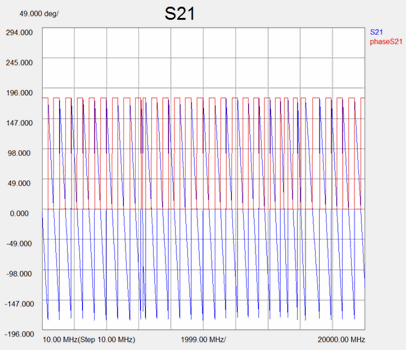
In the same way, you can compare the “phaseUnwrap()” equation with “Phase Unwrapped” display format.
These two methods display the same information.
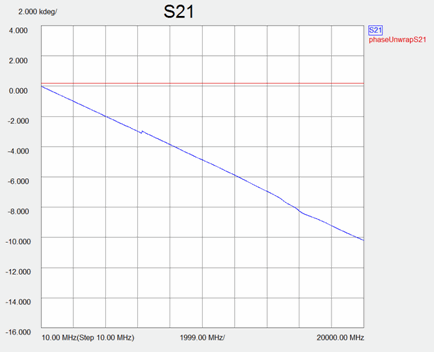
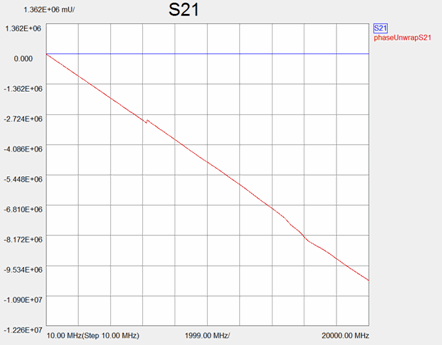
The blue trace (above) shows S21 in “Phase Unwrapped” format.
The red trace (below) shows equation “phaseUnwrap( 1:S21)” in “Real” format.
