Function Icon
Details

Click to increase the scale in a 1-2-5 sequence. The width of the waveform compresses. The default value for basic time units is 1.0 ns/div

Click to decrease the scale in a 1-2-5 sequence. The width of the waveform expands.
Other topics about Making Measurement
Select the trace which you want to change the scale.
Click on the Auto Scale button on the tool bar or right-click in the graph plot area.
Select the desired scale. Refer to the table below for the details of each selection.
|
Scale |
Details |
|
Auto Scale X |
Auto scaling X axis only, on the active trace |
|
Auto Scale Y |
Auto scaling Y axis only, on the active trace |
|
Auto Scale X & Y |
Auto scaling both X & Y axis, on the active trace |
|
Auto Scale All |
Auto scaling both X & Y axis, on all traces |
Select the trace which you want to change the scale.
Click the TDR/TDT tab.
Using Virtual knob
Type in Entry box
Click in the box below the left knob under Horizontal. An Entry dialog box appears.
Type the precise value.
Clicking Wave icons
Click the wave icons above the left knob under Horizontal. Details are as table below:
|
Function Icon |
Details |
|
|
Click to increase the scale in a 1-2-5 sequence. The width of the waveform compresses. The default value for basic time units is 1.0 ns/div |
|
|
Click to decrease the scale in a 1-2-5 sequence. The width of the waveform expands. |
The reference point of horizontal axis can be selected from the center line or left edge of the displayed graticule.
Click the icon as shown in table below under Horizontal to change the reference point:
|
Function Icon |
Details |
|
|
Reference point of the display graticule to the left edge. The position of left edge is not changed even if you change the scale. |
|
|
Reference point of the display graticule to the center. The position of center is not changed even if you change the scale. |
Select the trace which you want to change the horizontal position.
Click the TDR/TDT tab.
Using Virtual knob
Type in Entry box
Clicking Arrow icons
Click the arrow icons above the right knob under Horizontal. Details are shown in the table below:
|
Function Icon |
Details |
|
|
Click to increase the delay from trigger; the waveform moves to the left of the display. |
|
|
Click to decrease the delay from trigger; the waveform moves to the right of the display. |
Select the trace which you want to change the scale.
Click the TDR/TDT tab.
Using Virtual knob
Type in Entry box
Clicking Wave icons
Click the wave icons above the left knob under Vertical. Details are as table below:
|
Function Icon |
Details |
|
|
Click to increase the scale in a 1-2-5 sequence; the waveform height compress. |
|
|
Click to decrease the scale in a 1-2-5 sequence; the waveform height will expand. |
Select the trace which you want to change the vertical position.
Click the TDR/TDT tab.
Using Virtual knob
Type in Entry box
Clicking the Arrow icons
Click the arrow icons above the right knob under Vertical. Details are as table below:
|
Function Icon |
Details |
|
|
Click to increase the offset value; the waveform shift downward. |
|
|
Click to decrease the offset value; the waveform shift upward. |
Drag and drop
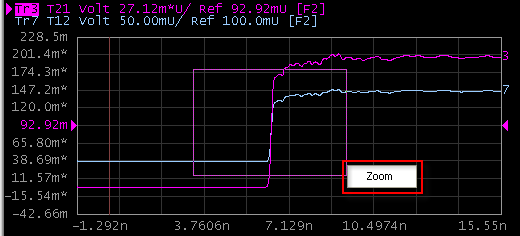
To zoom in the graph plot:
Left-click and hold the mouse button.
Drag the area you would like zoom and release the mouse button.
Select zoom as shown below.
