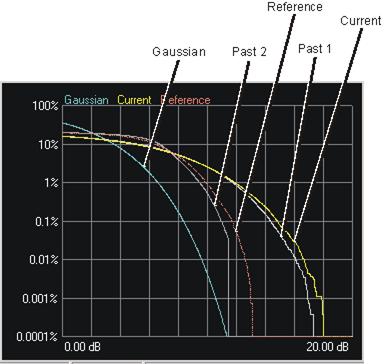
The Multitone mode and the Noise Power Ratio mode access the CCDF plot. The CCDF graph shows the composite plot and peak-to-average values for all waveforms.
The CCDF graph displays the probability (in percentage) of the generated waveform's calculated peak-to-average power ratio (measured in dB) meeting or exceeding a certain level. The table to the left of the CCDF plot displays the calculated peak-to-average values for the current waveform. For additional information, see Understanding CCDF Curves.
Each time you adjust parameters and generate a waveform, a plot is added
to the  graph.
The graph retains your three most recent plots (in shades of gray), allowing
you to make comparisons of waveform characteristics.
graph.
The graph retains your three most recent plots (in shades of gray), allowing
you to make comparisons of waveform characteristics.
Use the buttons shown below to plot the Gaussian data, reference data and generated waveform data to the CCDF graph. The graph's initial state shows only the Gaussian curve (blue) until you generate a waveform.
![]()
Click the Gaussian button to toggle the view of the band-limited Gaussian noise curve (blue).
![]()
Click the Reference button to toggle the view of the reference curve (red). The reference appears as a flat line until you generate a waveform and click the Acquire Ref. button.
![]()
Click the Acquire Ref. button to make the current waveform curve (yellow) the reference curve (red). Click the Reference button to view the reference curve.
![]()
Click the Update button to build a new waveform and calculate a new CCDF plot.

Click the Export button to save the current CCDF plot data to a .txt file.

Click the Import button to and load a .txt data file and display as a User Data curve when the User Data button is selected.

Click the User Data button to display an imported User Data curve (imported as a .txt file by clicking the Import button).