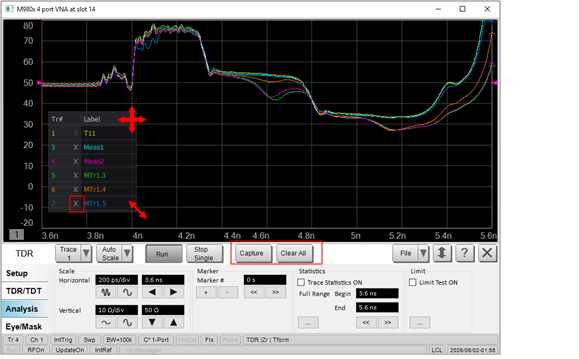
Allows multiple TDR traces to be overlaid for waveform comparison.
See also Command Finder.
Trace Select the trace number of the data trace.
Capture Click to create a new trace, copy the trace data from the selected data trace. The new trace remians unchanged when measurements are updated by a new sweep.
Clear All Remove all captured traces.
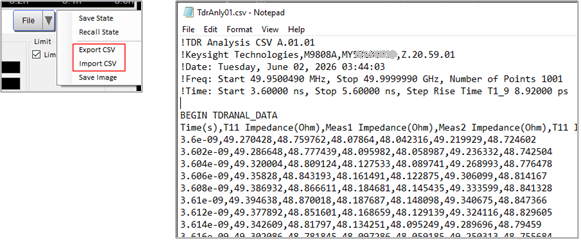
File
Export CSV Export all display traces to a .csv file.
Import CSV Import traces from a .csv file.
Learn more in TDR Screen Area.

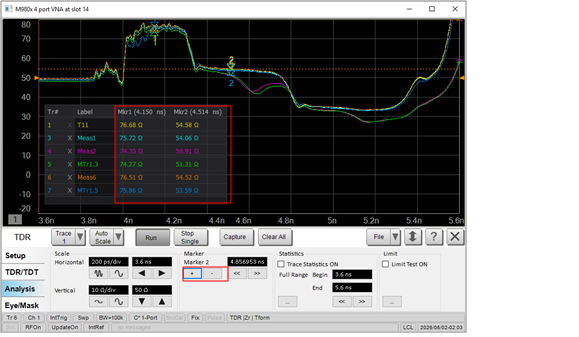
Marker
+ Turn on the next available marker.
- Turn off the currently active marker.
Entry Box Enter an X-axis value to position the current active marker.
<< Move the active marker to the previous marker.
>> Move the active marker to the next marker.

Statistics
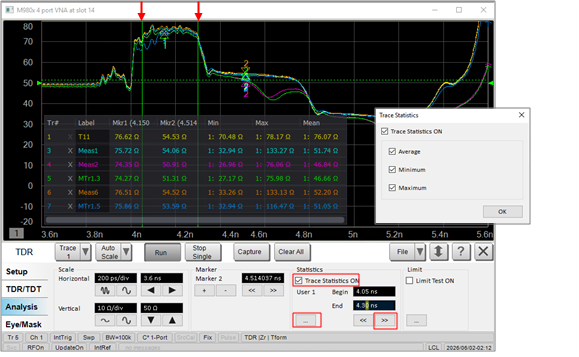
Trace Statistics ON Select this checkbox to enable trace statistics.
<< Move the selected user range to previous range.
>> Move the selected user range to next range.
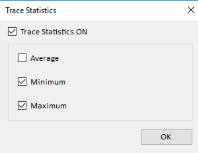
... Click to open Trace Statistics dialog, where user can select the statistic to display: Average/ Minimum/ Maximum

Limit
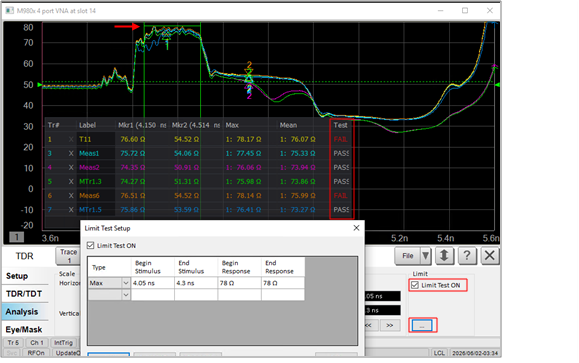
Limit Test ON Select this checkbox to enable the limit test.
... Click to open Limit Test Setup diaolog below.
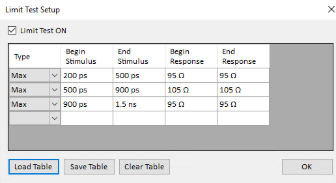
Limit Test ON Select this checkbox to enable the limit test.
Type Select the limit type: Off, Min or Max.
Load Table Enter limit values manually or load a previously saved limit table in .csv format.
Save Table Save the current limit table as a .csv file.
Clear Table Click to remove all limit line data from the table.
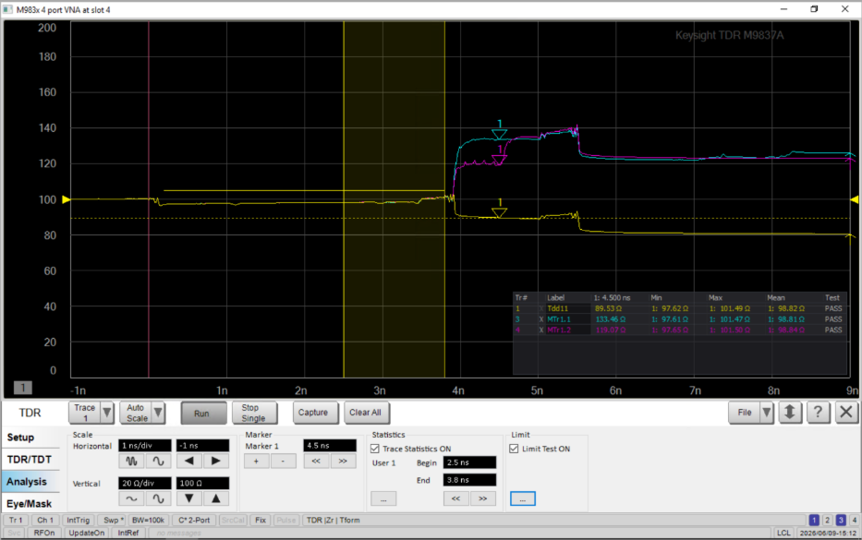
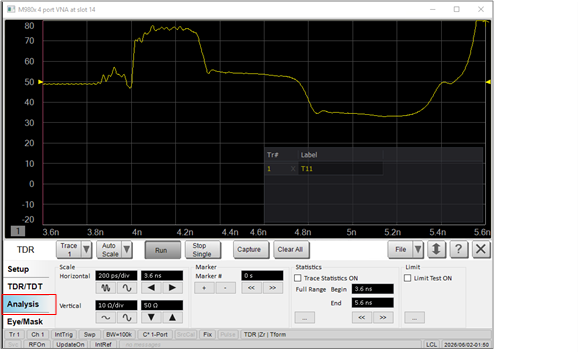
The Analysis Table is displayed when Analysis Mode is enabled.
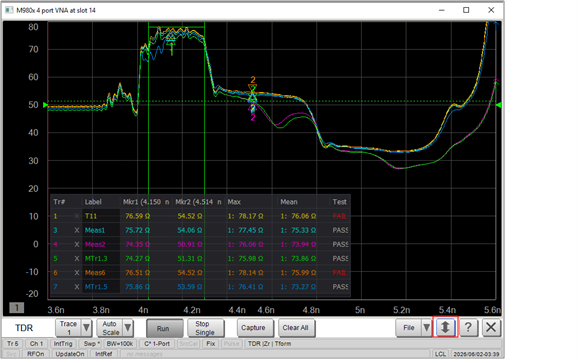
Trace annotations, statistics readouts, marker readouts, and limit test Pass/Fail results are displayed in the Analysis Table rather than in the graph window.
Launch the TDR application ( Meas > Meas Class... > TDR).
Select a time domain trace. Adjust the measurement settings for the target trace on the Setup and TDR/TDT pane.
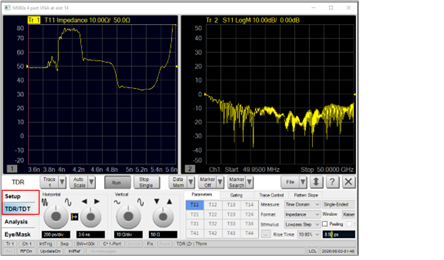
Click “Analysis” pane
Click Capture to add multiple memory traces. Adjust the table size and position. Rename the label and delete traces.
Marker: Up to 9 markers. Adjust the position on the trace. The table shows the X and Y readouts.
Statistics: Press >> to change analysis range. The lines show the range.
Click … button to select Min/Max/Mean.
Limit test
Maximize the trace area.
Export and import CSV.