Advanced Waveform Utility
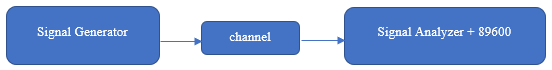
Before performing a calibration, you will need 89600 VSA (Vector Signal Analyzer) software to measure the output of the signal analyzer. See hardware connection diagram (Figure 1) below.
Figure 1 (above). Hardware configuration to measure SA output before calibration.
One-Stage Homodyne Calibration
Two-Stage Homodyne Calibration with DUT
The purpose of the calibration is to correct for the impact of non-ideal channel responses. This is done by demodulating the 16QAM signal with the VSA and then making a reversion process on the target waveform, thus providing the ideal signal at the input port of the signal analyzer.
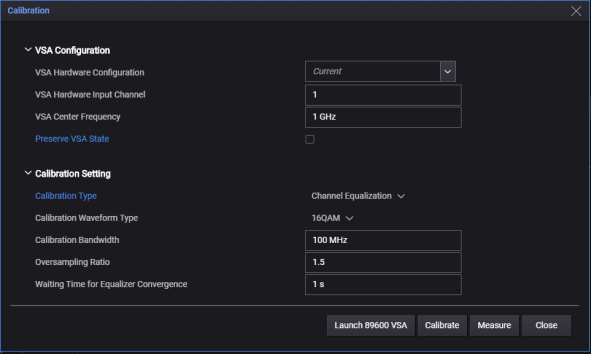
Figure 2 (above). Calibration Dialog.
VSA Hardware Configuration is used to select hardware from the VSA hardware resources.
Before selecting a VSA hardware configuration, click or touch the Launch 89600 VSA button. This opens the VSA software, providing it is installed, and retrieves the configured signal analyzer hardware configurations that you can now select from.
The Calibrate button performs the operation steps shown in Figure 3 to get the correction filter file, which will be used in the waveform downloading procedure.
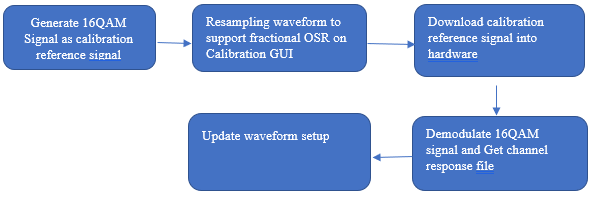
Figure 3 (above). Calibration Process.
This is done by calling WCF API of N7608 with the setting below.
When generating a 16QAM/QPSK/BPSK signal, the symbol rate is determined by the target calibration bandwidth from the GUI. For example, if the calibration bandwidth is 100 MHz, symbol rate is 100 MHz.
Because of limitations of the maximal sample rate of signal generator hardware, sometimes a re-sampling operation will need to be performed on generated 16QAM signal. This is done by invoking the N7608 API.
Follow same procedure as the normal downloading operation.
In this process, AWU will try to launch the installed VSA 89600, which will take a long time. Therefore, it is best to launch the VSA 89600 and connect to the target signal analyzer before making the calibration.
When the calibration is finished, the channel response file will be displayed and saved to “c:\Temp\ChannelCorrection.csv”.
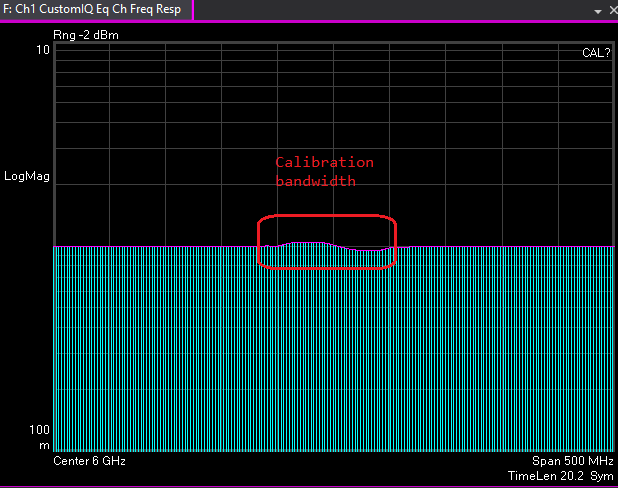
Figure 4 (above). Calibration Bandwidth.
Once the Calibration is finished, the Apply Correction Filter setting is enabled on the Waveform GUI.
And the Correction Filter File is assigned to the default correction file.
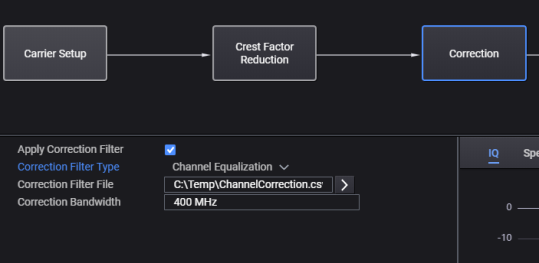
Figure 5 (above). Waveform Settings - Apply Correction Filter Checkbox.
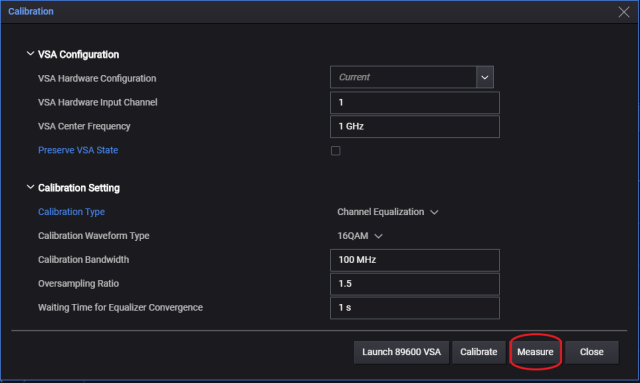
Figure 6 (above). The Measure Function.
The Measure button is used to perform a pure VSA measurement. The difference between Calibrate and Measure is that the Measure action will not generate a calibration signal, nor reset the 89600 VSA.
To make the calibration with user-defined demodulation parameters, perform the steps below:
Perform Calibrate.
Change VSA parameters except frequency and span, using the 89600 VSA GUI.
Perform Measure.
In the previous AWU version, we provided channel equalization to correct the impact caused by non-ideal channel response. However, modulated single carrier correction using equalizer frequency response has a bandwidth limitation depending on the Filter Alpha. To get nearly 100% source bandwidth corrected, it would be good to support multitone signal as the stimulus.
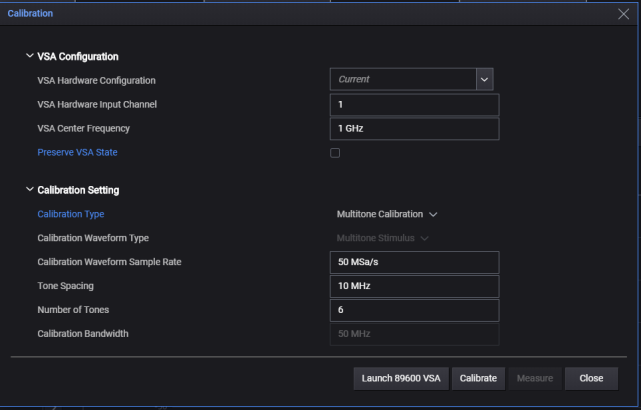
Figure 7 (above). Calibration Type set to Multitone Calibration.
Once "Calibrate" button is clicked, it will go through the following procedures to get the correction filter file.

First, we create several tones spaced evenly around the center frequency. The tones are pure sine wave. We should set proper values for tone spacing and number of tones. For example, the default setup has a frequency of 1 GHz and 6 tones with 10 MHz spacing. When this waveform is output, the source will output a 0 dBm signal at the following frequencies: 0.975, 0.985, 0.995, 1.005, 1.015, and 1.025 GHz. The calibration bandwidth is (number of tones - 1) * tone spacing, which should not be larger than the calibration waveform sample rate.
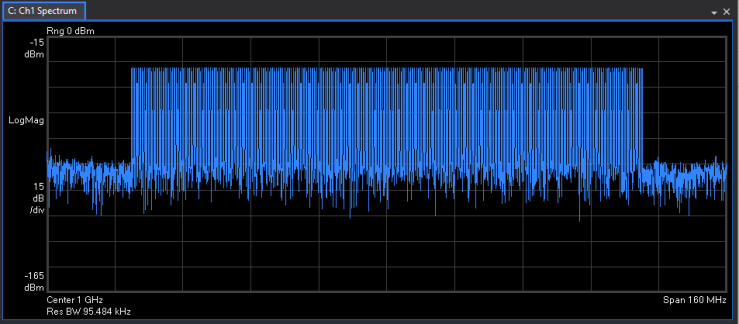
Figure 8 (above). Multitone Signal.
The following hardware connection should be prepared before calibration. 89600 VSA is controlling the signal analyzer or oscilloscope to measure the output signal.

In multitone calibration, we will use the Channel Quality measurement in VSA. When the measurement is finished, the amplitude and phase of the channel response will be displayed on 89600 VSA (See Figure 9 and Figure 10). The trace file will be saved to "%USERPROFILE\Documents\Keysight\PathWave\SignalGenerationDesktop\Data\MtResp.csv."
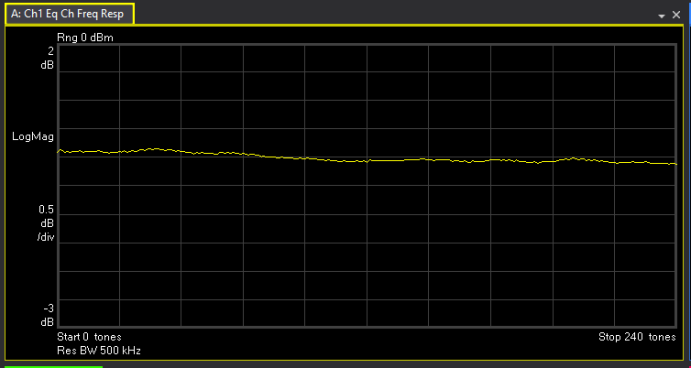
Figure 9 (above). Amplitude channel response for multitone calibration.
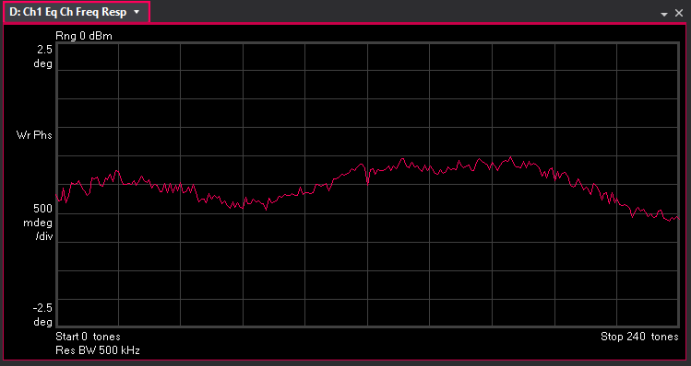
Figure 10 (above). Phase channel response for multitone calibration.
The channel quality measurement is part of -200 VSA basic license option, so it is better than the current EQ Cal which needs additional -AYA VSA license.
Once Calibration is finished, Apply Correction Filter setting is enabled on Waveform GUI and Correction Filter File is assigned to default correction file. Calibrated Bandwidth is read out from the correction filter file. You can set the correction bandwidth as needed, but it should not exceed the calibrated bandwidth.
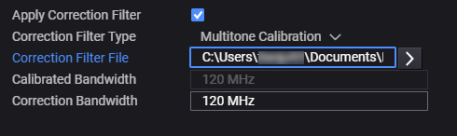
Figure 11 (above). Apply Correction Filter and related settings.
The purpose of IQ Calibration is to perform the processing required to take the measured predefined sequence values and compute two filters: a real filter to match Q to I, and a complex filter to correct for the combined RF and baseband response of the modulator.
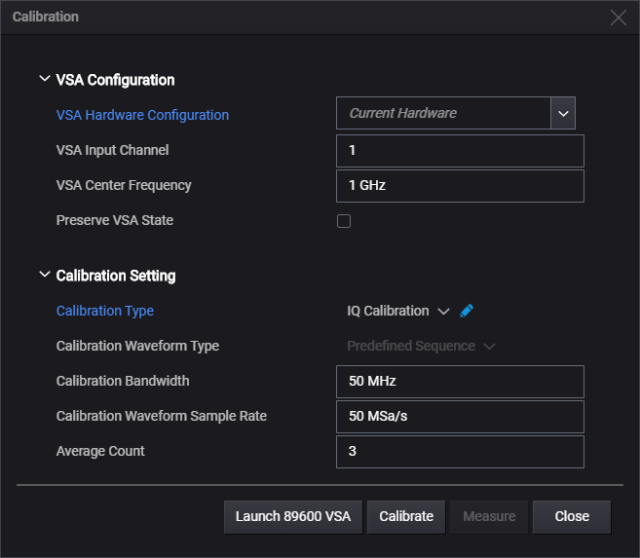
Figure 12 (above). Calibration Type set to IQ Calibration.
Once Calibration button clicked, the operation below will be performed to get correction filter file which will be used in waveform downloading procedure.


Same as in Multitone Calibration.
In this step, AWU will try to launch installed VSA 89600 to capture I/Q data from hardware.
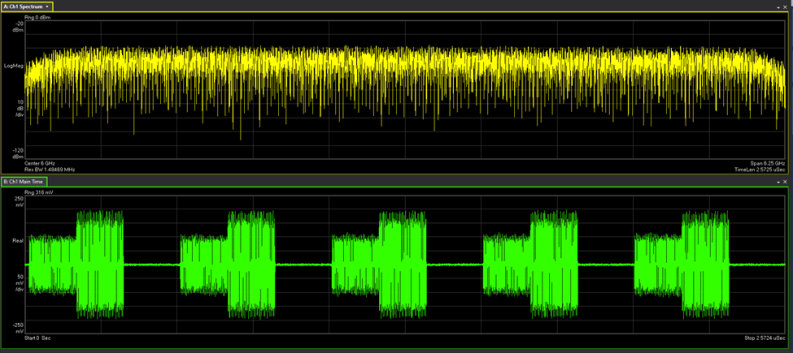
Figure 13 (above). I/Q data from 89600 VSA.
Our correction strategy has three layers. First, we figure out the quadrature error and fix them. Then we correct the response of the Q path to exactly match the I path with h_IQCorr(t). Once I and Q are matched, then we have a single complex filter h_FCorr(t) that removes the net frequency response of the baseband and RF portions of signal generation.
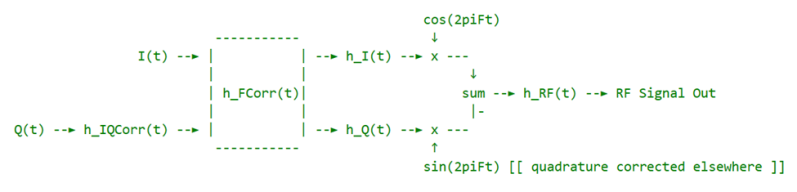
Figure 14 (above). Correction Computation.
When calibration is finished, channel response file will be read out and saved to "%USERPROFILE\Documents\Keysight\PathWave\SignalGenerationDesktop\Data\IQChannelImpulse.json"
Once calibration is finished, Apply Correction Filter setting is enabled on Waveform GUI and Correct Filter File is assigned to default correction file. Correction bandwidth and correction waveform sample rate is read out from the correction filter file.
Figure xx02 (above). S2P Correction settings.
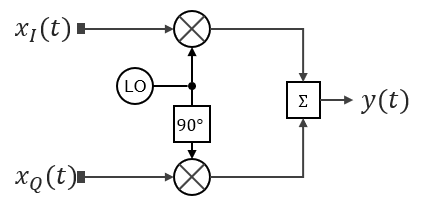
Figure 15 (above). One-Stage Homodyne calibration schematic
In AWU 2024U1.0, we are using the multitone stimulus generated from 89600 VSA to calibrate the homodyne system.
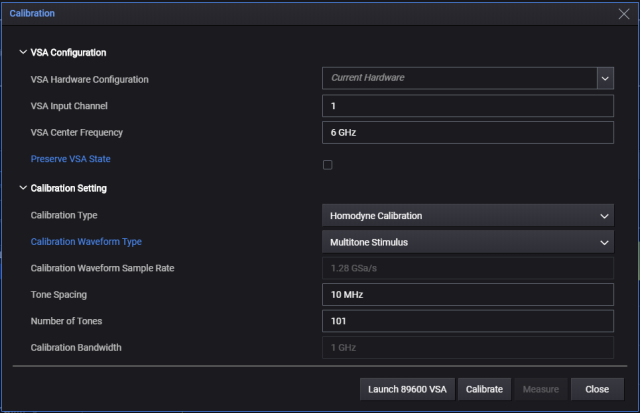
Figure 16 (above). GUI configuration for One-Stage Homodyne Calibration.
As we can see on the calibration wizard, once "Calibrate" button is clicked, it will go through the following procedures to get the correction filter file.

In homodyne calibration, the stimulus is generated by .NET API in 89600 VSA. The tone spacing and number of tones will be configured into the Channel Quality Properties in VSA Channel Quality Measurement. The phase is parabolic in default.
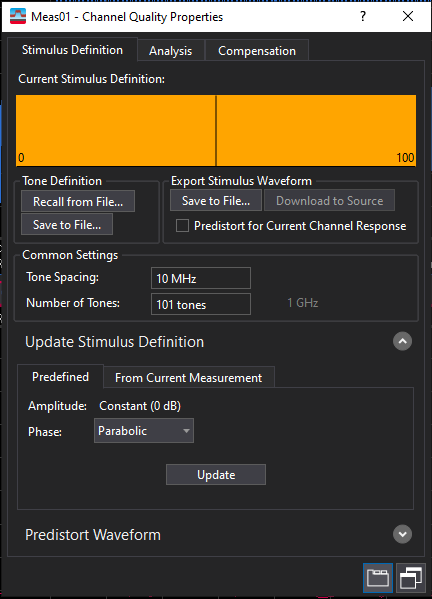
Figure 17 (above). VSA Channel Quality Properties.
After everything is configured, the stimulus.mat file will be generated and be saved to "%USERPROFILE\Documents\Keysight\PathWave\SignalGenerationDesktop\Data\stimulus.mat".
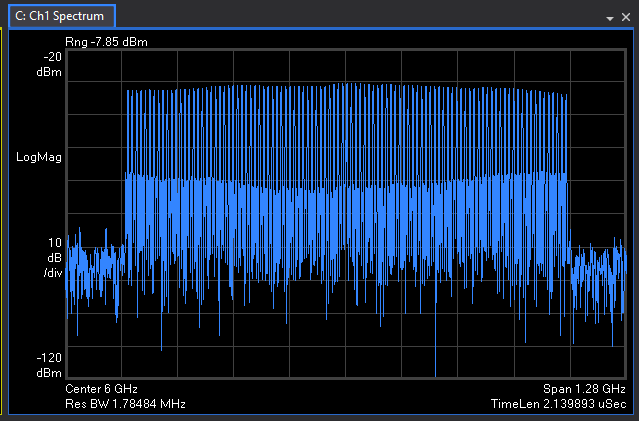
Figure 18 (above). Stimulus waveform.
Note that the sample rate of the stimulus waveform is fixed. Sample rate = 1.28 * (Number of Tones - 1) * Tone Spacing. It should be exactly equal to the sample rate of input waveform. Otherwise, the correction will not be successful.
The following hardware connection is an example for homodyne calibration. I and Q cables should have the same length. For baseband generator, a trigger output is required for accurate measurements. For receiver, any XSA and Scope can be used for analysis, as far as analyzer has enough frequency range and bandwidth to measure. 89600 VSA is controlling the XSA or Scope to measure the output signal.
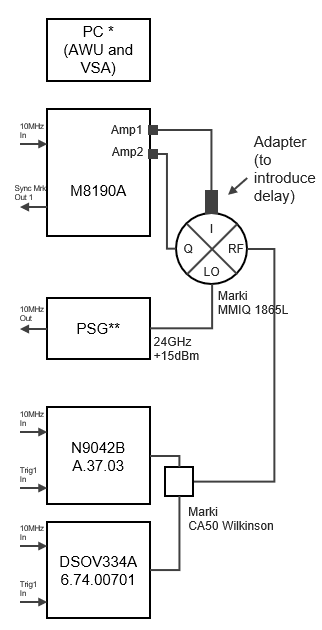
Figure 19 (above). Setup block diagram.
In homodyne calibration, we will use the Channel Qualify Measurement in VSA. When the measurement is finished, the amplitude and phase of the balanced and unbalanced inverse channel response  and
and  will be displayed on 89600 VSA. The trace file will be saved to "%USERPROFILE\Documents\Keysight\PathWave\SignalGenerationDesktop\Data\HBC.csv" and "%USERPROFILE\Documents\Keysight\PathWave\SignalGenerationDesktop\Data\HUC.csv"
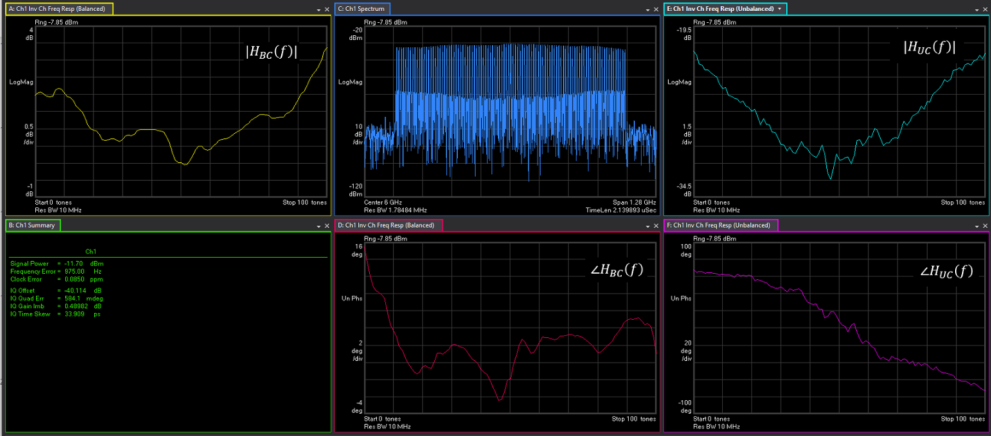
Figure 20 (above). VSA display for Channel Qualify Measurement.
After the calibration procedure is finished, Apply Correction Filter setting is enabled on Waveform GUI and Correction Filter File is assigned to default correction file. Quadrature error and IQ imbalance is read out from VSA summary.
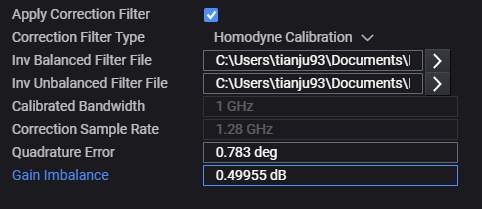
Figure 21 (above). One-Stage Homodyne Calibration settings.
If the user enables the homodyne correction filter in AWU, the inversed balanced and unbalanced filter file will be applied to the generated waveform by

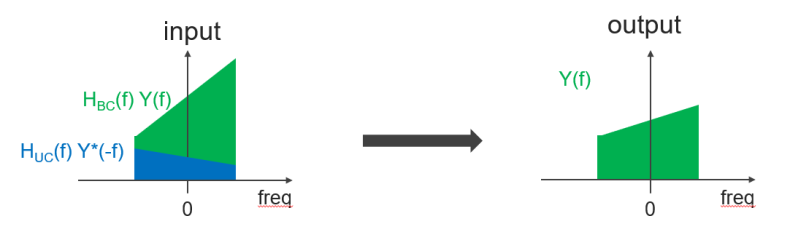
Figure 22 (above). Operation concept for One-Stage Homodyne Calibration.
In AWU 2024 U1.0, we also support two-stage homodyne calibration to get the impairment caused by DUT only. Here is an example for hardware connection.
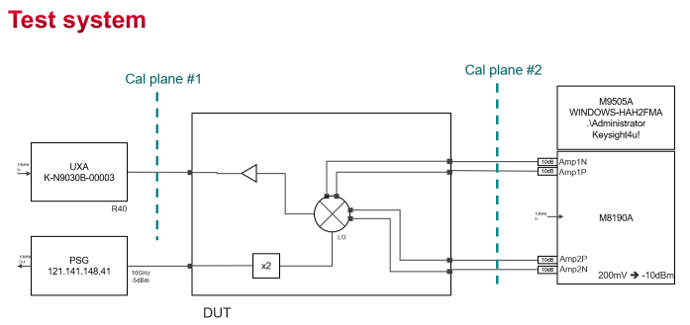
Figure 23 (above). Block diagram for Two-Stage Homodyne Calibration with DUT.
Connect MXR/UXR oscilloscope to Cal plane #2, then do the homodyne calibration as in one-stage case.
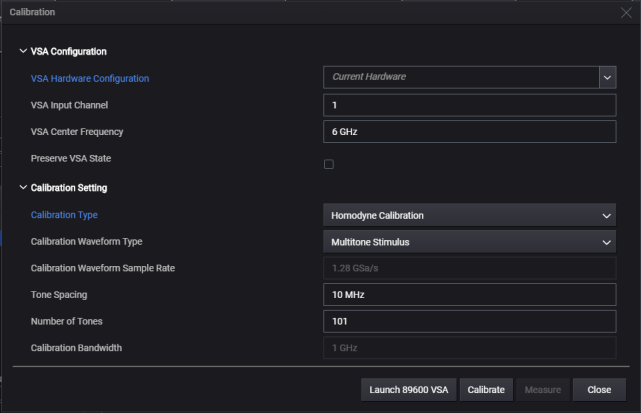
Figure 24 (above). GUI configuration for Two-Stage Homodyne Calibration with DUT for first calibration.
After the first calibration, a predistorted multitone stimulus waveform will be saved to "%USERPROFILE\Documents\Keysight\PathWave\SignalGenerationDesktop\Data\predistorted.mat". It will be used as the test waveform for the next calibration.
Connect DUT and UXA to Cal plane #1. Switch to Predistorted Multitone Stimulus, then perform homodyne calibration again.
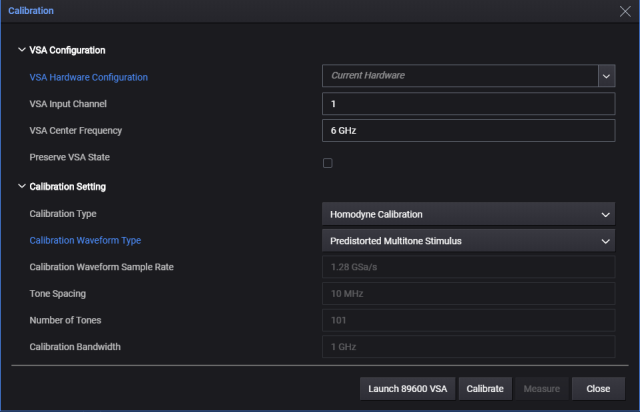
Figure 25 (above). GUI configuration for Two-Stage Homodyne Calibration with DUT for second calibration.
The receiver does not need to be UXA, if the MXR/UXR scope is capable of measuring RF. After the second calibration, we will get the balanced and unbalanced inverse filter file caused by DUT only in “%USERPROFILE\Documents\Keysight\PathWave\SignalGenerationDesktop\Data”.