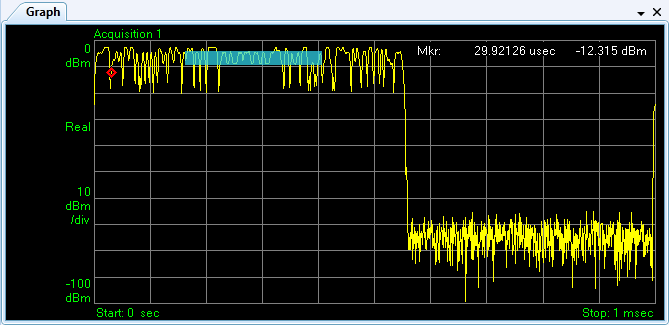
The graph portion of the Sequence Studio user interface displays a captured trace from the test set's analyzer, so that analysis intervals within an acquisition (represented on the graph by blue bars) can be properly aligned with the signal of interest.
The graph displays a trace retrieved from the test set's analyzer (see ReadTrace).
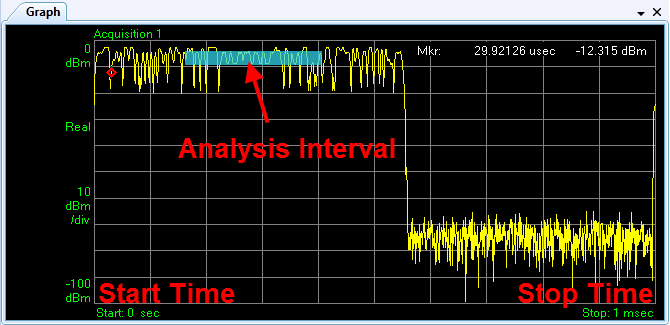
The top and bottom of the vertical axes represent the power range of the auto-scaled graph. The left and right of the horizontal axes represent the beginning and end of the acquisition. Any analysis intervals created (using the Edit Analysis Steps window) are represented by blue bars.
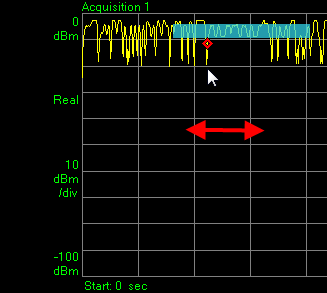
The position of the trace marker is adjustable, as you move the marker along the trace, its X/Y coordinates on the graph are updated, as displayed in the time/power values at the upper right corner of the graph.
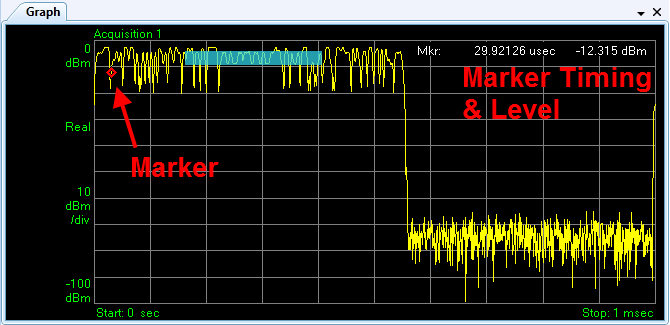
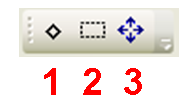
Click this the Graph Marker Select icon (1), then move the cursor horizontally on the graph screen to drag the red diamond marker along the displayed trace.
Click the Graph Zoom Select icon (2), then click and drag the cursor within the graph screen to outline a rectangle. This is the zoom area.
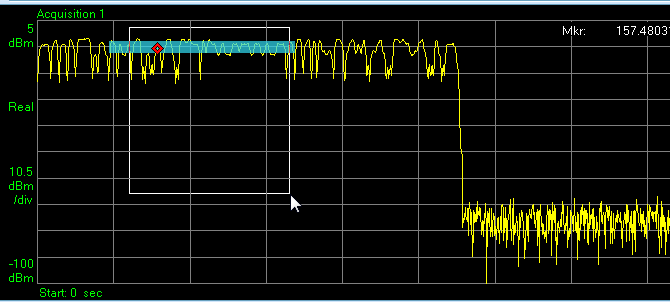
When you release the mouse button, the region of the graph which you outlined with the rectangle expands to fill the graph window.
Click the Autoscale Graph icon (3) to cancel the effect of the zoom, and restore the automatically scaled graph view.
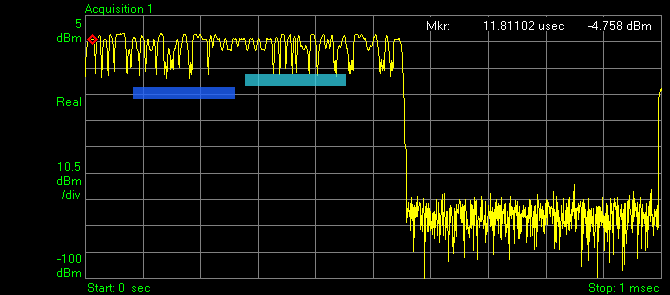
The bar for the analysis step which is currently selected within the Analysis Step Table is distinguished by a lighter shade of blue than other bars. This is the bar which will change width or position on the graph when adjustments are made to that analysis interval in the Edit Analysis Steps window.
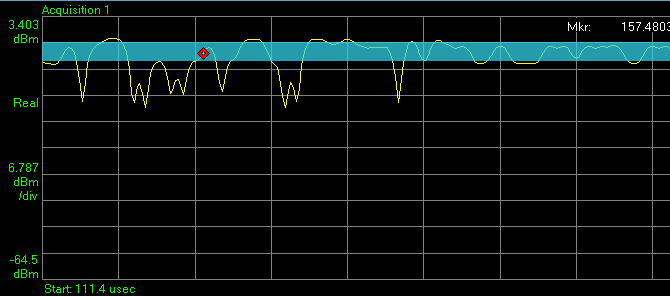
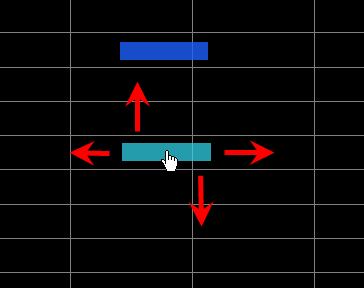
Click the Graph Marker Select icon (1), then select a blue bar on the graph by clicking in the middle of it; at that point you can also adjust the expected power level for that step by dragging the bar vertically, or adjust the analysis offset by dragging the bar horizontally:
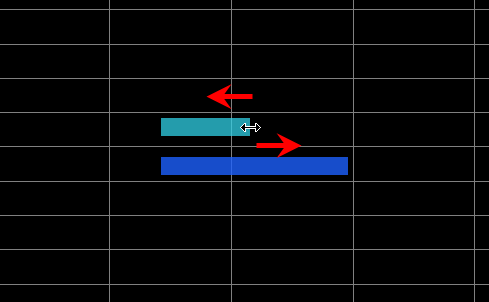
Also, you can shorten or lengthen the analysis interval, by clicking on the right edge of the bar and dragging it horizontally:
Adjusting the blue bars in this way requires that you have clicked the Graph Marker Select icon (1); if you have clicked the Graph Zoom Select icon (2) instead, clicking and dragging within the graph will result in a zoom.
The graph window can be closed by clicking on the "X" at its upper right corner; to restore it, select Show Graph Window on the Window menu.