Press Meas/View > Phase Noise to select the phase noise measurement window. Press Window Max to maximize the window
Press Trigger > Trigger to Phase Noise > Continuous to start measurements.
Press Trigger > Source > Internal.
Press Setup > Capture Range > Normal for PLL method.
Press Setup > Auto Setting. When "IF A/D overflow" is displayed, decrease 10 dB from the current IF Gain setting (Press Setup > IF Gain).
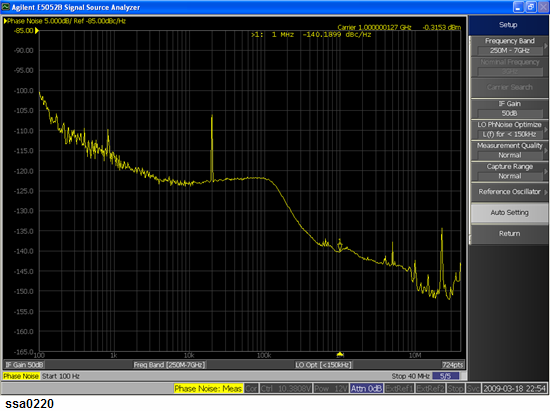
Press Start/Center (Stop/Span), set Start > 100Hz and Stop > 40MHz.
Press Avg/BW > Avg factor > 5 > Averaging > ON to reduce fluctuation, then press Averaging Restart.
Press Scale > Auto Scale.
Press Marker > Marker1 > 1 > M/μ to check phase noise at 1MHz offset.
The marker value is displayed in the upper part of the trace screen.
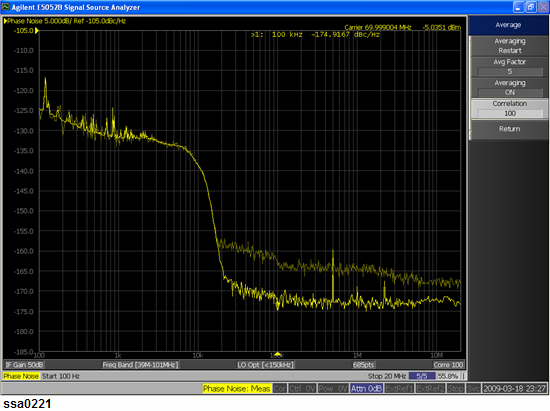
If the 1GHz signal is a clean signal, the correlation function can be used for noise floor reduction.
The following is an example of a 70 MHz clean signal measurement.
Press Avg/BW > Correlation > 1, then set Avg factor > 5 and turn Averaging > ON, then press Averaging Restart.
Press Trace/View > Data -> Mem, then press Display Trace > Data & Mem.
Press Avg/BW > Correlation and input 100, then press Averaging Restart.
If the 1 GHz signal is a signal of a VCO, you can control the frequency of the signal by using the automatic frequency control (AFC) function.
Press DC Control > Auto Freq Control.
Set Target > 1GHz.
Set Tolerance > 10kHz.
Set Sensitivity > 10MHz/V.
Press AFC Status, then turn “ON” to activate AFC. When “AFC out of loop” message is displayed, change the value for tolerance or sensitivity to a value larger than the current setting.
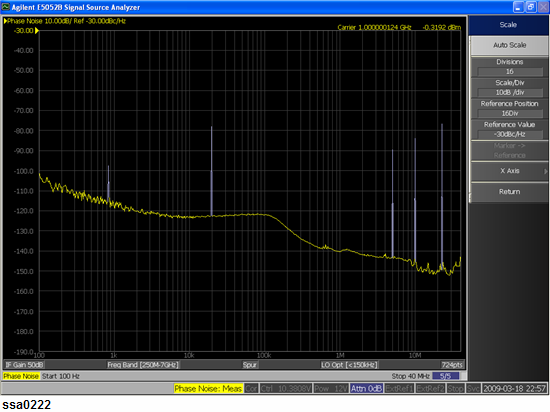
Press Trace/View > Spurious > Power (dBc). Then set Spur Sensibility > 3 and Minimum Spur Level > -100 dBc.
Press Scale > Auto Scale.
Spurious are displayed by high light. Then press Spurious List, you can view response values for the spurious in a text file.
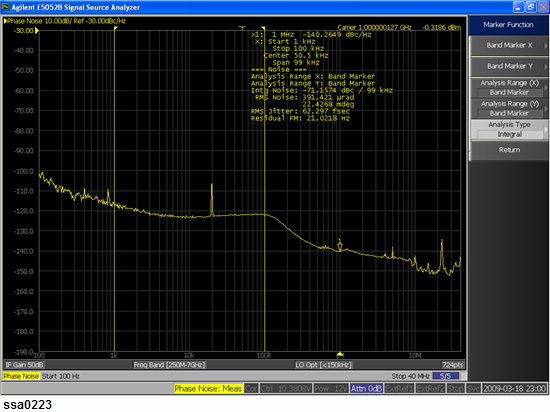
Press Marker Fctn, then Band Marker > ON
Press Start/Center (Stop/Span), set Start > 1kHz and Stop > 100kHz
Press Marker Fctn, then Analysis Type > Integral. In the upper right part of the screen, you can see the Integral Phase Noise value [dBc], the RMS Noise value [rad, deg], the RMS Jitter value [sec] and Residual FM value [Hzrms].
The band marker span is derived from interpolated values (including measurement points). On the other hand the noise span is derived from measurement points directly, so the two data take different values when the band marker is at interpolated points.
The segment phase noise measurement allows you to analyze detail of spurious response with variable RBW setting.
This figure below shows a phase noise measurement.
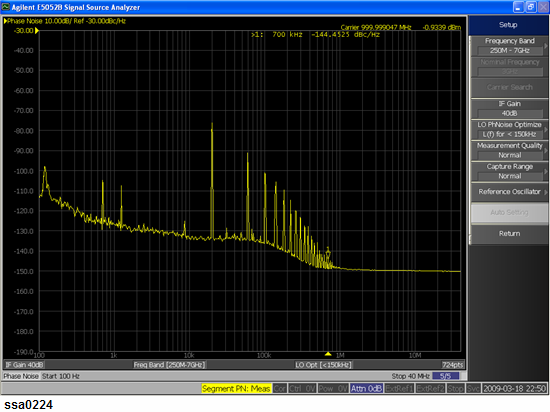
The following steps are for analyzing the spurious around 700kHz frequency offset.
Press Meas/View > Show Window > Segment PN to toggle ON the segment phase noise measurement.
Press Meas/View > Segment PN to select the segment phase noise measurement window.
Press Trigger > Trigger to Segment PN > Continuous to start measurements.
Press Trigger > Source > Internal
Press Setup > Capture Range > Normal for PLL method
Press Setup > Auto Setting
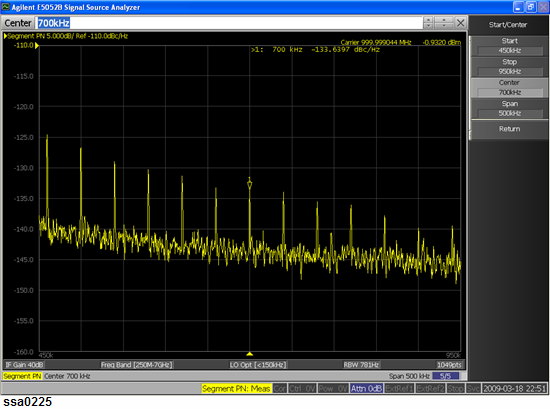
Press Start/Center (Stop/Span), set Center > 700kHz and Span > 500kHz
Press Avg/BW > RBW > 781Hz
Press Avg/BW > Avg factor 5 > Averaging > ON to reduce fluctuation, then press Averaging Restart
Press Scale > Auto Scale
For more information about phase noise measurement, see Phase Noise Measurement.