This topic contains the measurement uncertainty equations used to generate the uncertainty curves in Specifications documents.
It also contains general information about determining system measurement uncertainties.
Note: RSS Computations are included along with worst case computations.
Learn about the following subjects in this topic:
Determining Cable Stability Terms (CR1, CR2, CTM1, CTM2, CTP1, CTP2)
Any measurement result is the vector sum of the actual test device response plus all error terms. The precise effect of each error term depends on its magnitude and phase relationship to the actual test device response. When the phase of an error response is not known, phase is assumed to be worst case (-l80x° to +180°).
Note: The uncertainty equations are derived for two-port measurement uncertainties. However, uncertainties for a one-port device can be derived by setting S21=0 then computing the reflection uncertainties.
View the abbreviations for residual systematic errors used in the equations.
View the abbreviations for random errors used in the error models and equations.
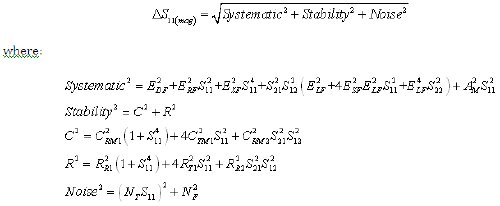
Equation 1: Forward Reflection Magnitude Uncertainty (Worst Case Computation)
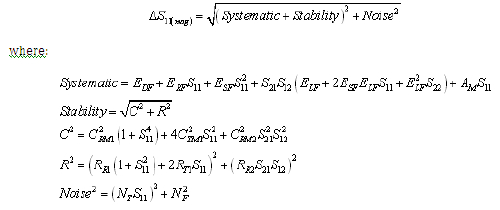
Equation 2: Forward Reflection Phase Uncertainty (Worst Case Computation)
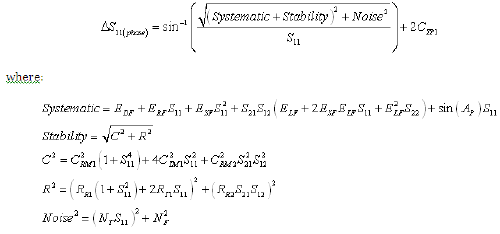
Equation 3: Forward Reflection Magnitude Uncertainty (RSS Computation)

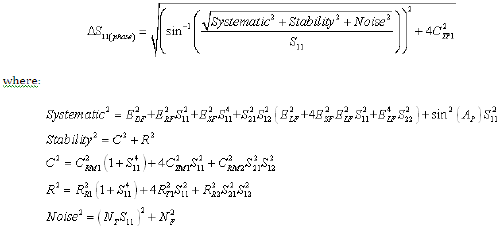
Equation 4: Forward Reflection Phase Uncertainty (RSS Computation)
Equation 5: Forward Transmission Magnitude Uncertainty (Worst Case Computation)
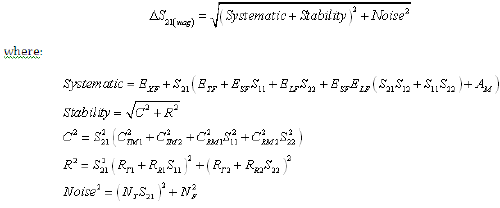
Equation 6: Forward Transmission Phase Uncertainty (Worst Case Computation)
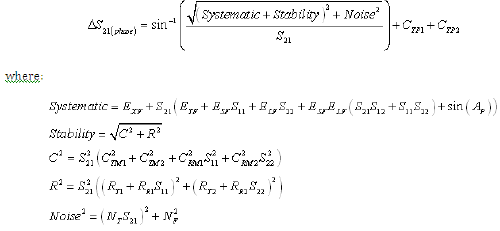
Equation 7: Forward Transmission Magnitude Uncertainty (RSS Computation)
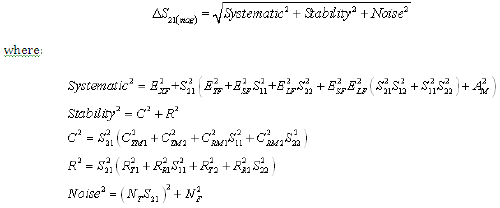
Equation 8: Forward Transmission Phase Uncertainty (RSS Computation)
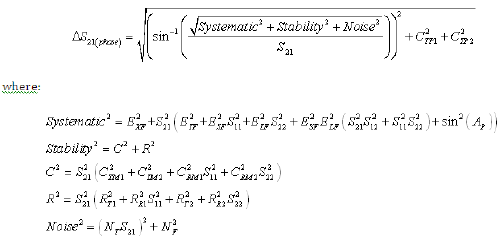
Equation 9: Reverse Transmission Magnitude Uncertainty (Worst Case Computation)
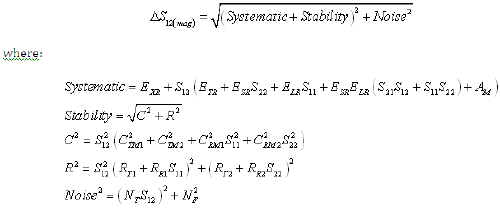
Equation 10: Reverse Transmission Phase Uncertainty (Worst Case Computation)
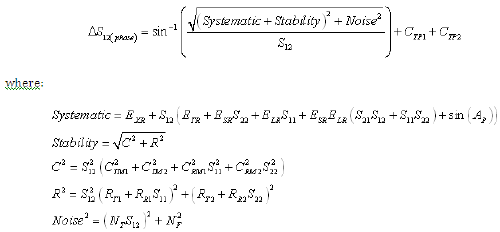
Equation 11: Reverse Transmission Magnitude Uncertainty (RSS Computation)
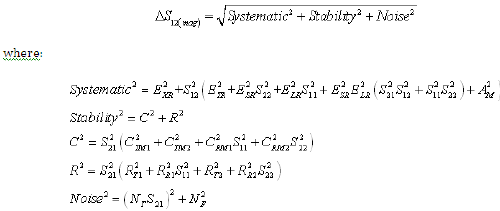
Equation 12: Reverse Transmission Phase Uncertainty (RSS Computation)
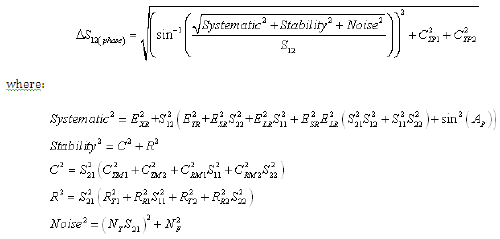
Equation 13: Reverse Reflection Magnitude Uncertainty (Worst Case Computation)
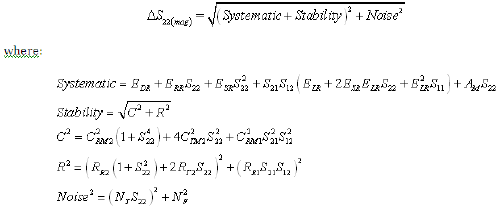
Equation 14: Reverse Reflection Phase Uncertainty (Worst Case Computation)
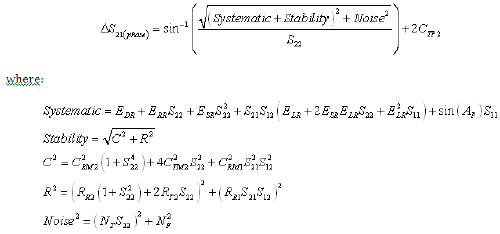
Equation 15: Reverse Reflection Magnitude Uncertainty (RSS Computation)
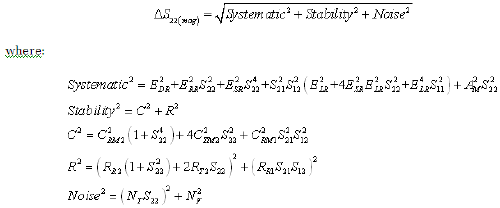
Equation 16: Reverse Reflection Phase Uncertainty (RSS Computation)
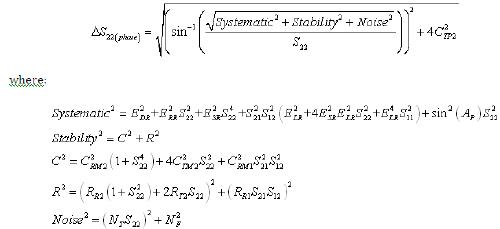
The residual (after measurement calibration) systematic errors result from imperfections in the calibration standards.
For reflection measurements, the associated residual errors are:
|
|
For transmission measurements, the additional residual errors are:
|
|
The listing below shows the abbreviations used for residual systematic errors that are in the uncertainty equations.
|
|
All measurements are affected by dynamic accuracy. Dynamic accuracy includes: errors during internal self-calibration routines, gain compression in the microwave frequency converter (sampler) at high signal levels, errors generated in the synchronous detectors, localized non-linearities in the IF filter system, and from LO leakage into the IF signal paths.
The random error sources are
noise
connector repeatability
interconnecting cable stability
There are two types of noise in any measurement system:
low level noise (noise floor)
high level noise (trace noise)
Low level noise is the broadband noise floor of the receiver which can be reduced through averaging or by changing the IF bandwidth.
High level noise or trace noise is due to the noise floor of the receiver, and the phase noise of the LO source inside the test set. It is worsened by reducing the IF bandwidth. Using a high stability 10 MHz time base can reduce high level noise.
Connector repeatability is the random variation encountered when connecting a pair of RF connectors. Variations in both reflection and transmission can be observed.
Cable stability is dependent on the cable used and the amount of cable movement between calibration and measurement.
The listing below shows the abbreviations used for random errors in the error models and uncertainty equations.
|
|
Improper connection techniques and contact surfaces can degrade measurement accuracy.
Proper connection techniques include using a torque wrench with proper torque limits, ensuring that the connector pin depths meet specifications, ensuring that the center conductor of sliding loads is properly set, and observing proper handling procedures for beadless airlines.
Contact surface errors are caused by improper cleaning procedures, scratches, worn plating, and rough seating. View more information on connector care
If proper connection techniques and connector care is observed, the following table provides an indication of connector repeatability.
|
Connector Repeatability (RR1, RR2, RT1, and RT2) |
||||
|
Connector Type |
|
Connector Type |
||
|
Frequency Range |
Repeatability |
|
Frequency Range |
Repeatability |
|
2.4-mm |
|
3.5-mm |
||
|
0 to 2 GHz |
0.0002 |
|
0 to 2 GHz |
0.0001 |
|
2 to 20 GHz |
0.0004 |
|
2 to 8 GHz |
0.0003 |
|
20 to 36 GHz |
0.0006 |
|
8 to 20 GHz |
0.0006 |
|
36 to 40 GHz |
0.0008 |
|
20 to 26.5 GHz |
0.0010 |
|
7-mm |
|
Type-N |
||
|
0 to 2 GHz |
0.0001 |
|
0 to 2 GHz |
0.0006 |
|
2 to 8 GHz |
0.0003 |
|
2 to 8 GHz |
0.0006 |
|
8 to 18 GHz |
0.0006 |
|
8 to 18 GHz |
0.0010 |
|
Type-F |
|
Waveguide |
||
|
0 to 3 GHz |
0.0006 |
|
0 to 40 GHz |
0.0002 |
Cable stability is dependent on the cable used and the amount of cable movement between calibration and measurement. Values for cable reflection stability are determined by connecting a fixed load to the free end of the cable and measuring the change in reflection coefficient after flexing the cable through the normal range of cable movement for a particular setup. Cable transmission stability is determined by connecting a short to the free end of the cable and measuring the change in reflection coefficient due to changes in cable position.
Graphics 1-3 demonstrate concepts useful in determining cable stability. In each case, a cable (part number 8120-4779) was connected to port 1, with a fixed load connected to the free end. A reference trace is obtained by measuring S11 with the free end held close to port 2 and storing the results in memory. Two additional S11 measurements are made; one with the cable flexed out to its straight position and the other with the cable positioned back to the same location as reference trace. As shown in Graphic 1, the flexed position demonstrates the effect of moving the cable after calibration. The repeatability trace demonstrates the stability of the cable when moved to its original position.
Graphic 1
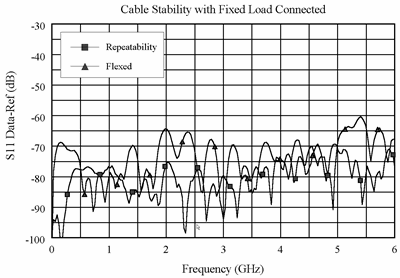
Graphic 1 demonstrates the concepts useful in determining cable reflection stability. A fixed load is connected to the free end. The DATA-MEM feature provides an indication of the cable reflection stability. A 60-dB peak on the chart yields a reflection stability estimated as 10(−60/20) or 0.001.
Graphic 2
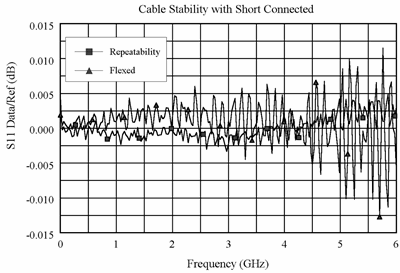
Graphic 2 and Graphic 3 demonstrate the concepts useful in determining cable transmission stability. A short is connected to the free end. The DATA/MEM feature provides an indication of the two-way cable transmission stability. The one-way transmission magnitude stability is determined by dividing the two-way magnitude measurement by two before it is converted to linear. A 0.013-dB peak on the chart yields transmission magnitude stability estimated as 10(0.013/40) −1 or 0.00075. The one-way transmission phase stability is determined by dividing the two-way phase measurement by two.
Graphic 3
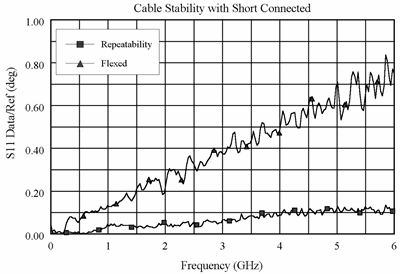
Cable movement often has a much larger effect on phase measurements than magnitude measurements.