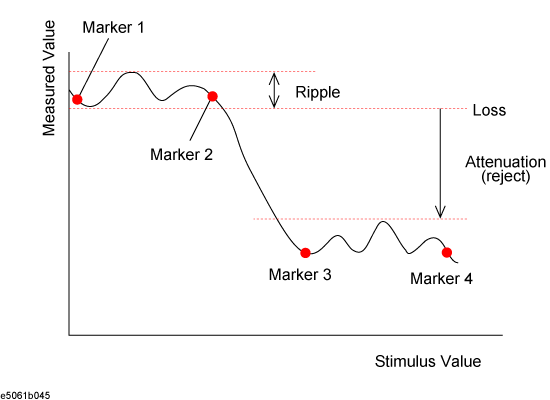
Specify the pass band with markers 1 and 2 on the trace and specify the stop band with markers 3 and 4 to obtain loss, ripple, and attenuation. The following figure shows data definitions.
Loss, Ripple, and Attenuation Parameters
|
Data Name |
Definition |
|
Loss (loss) |
Calculates the minimum value between markers 1 and 2. |
|
Ripple (p-p) |
Calculates the differences between the maximum value and the minimum value of markers 1 and 2. |
|
Attenuation |
Calculates the differences between the maximum value between markers 3 and 4 and the minimum value (loss) between markers 1 and 2. |
Press Channel Next (or Channel Prev) and Trace Next (or Trace Prev) to activate the trace of which you want to obtain the data.
Press Marker Fctn > RF Filter Stats to show the data.
Markers 1 through 4 are turned ON and displayed.
Set the positions of markers 1 through 4 on the trace.