This shows an example of WPT measurement.
VNA: E5061B with firmware revision B.04.1x or above
WPT Analysis Software: Option 006
Cal Kit: N4433A ECal (or any other Cal Kit support around 1 MHz to 10 MHz)
Adapter: N(m)-SMA(f), 2 ea
Test Cable: any lab quality cables with SMA(m) connectors, 2 ea.
DUT: A pair of coils, or resonators (Tx & Rx)
In this demo guide, resonators (resonance at 6.78 MHz) are used
Preset
Press Preset > OK to preset the analyzer.
Stimulus/Sweep Setup
Press Center and input 6.78 MHz in entry bar.
Press Span and input 2MHz in entry bar.
Press Avg > IFBW and input 1 kHz in entry bar.
Calibration using ECal (e.g., N4433A) at the end of test cables
Press Cal > ECal > 2-Port Cal.
Start WPT Analysis Software
Press Analysis > Start WPT Analysis.
Click OK.
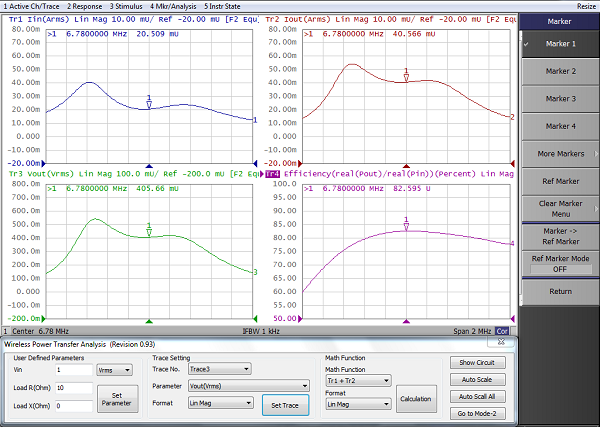
Setup for Measurement
Set User Defined Parameters and Change Trace Setting as needed (default setting works fine for demo).
Measurement
Connect DUT on Port1 and Port2.
Click Auto Scale All.
Data Analysis (Marker Function).
Click area on trace 4 or use Trace Prev/Trace Next to activate Tr4.
Press Marker and input 6.78 MHz in entry bar.
Read the marker value.
Marker can be moved by rotating the rotary knob.
Continued from Demo#01
Go to Mode-2
Click Go to Mode-2.
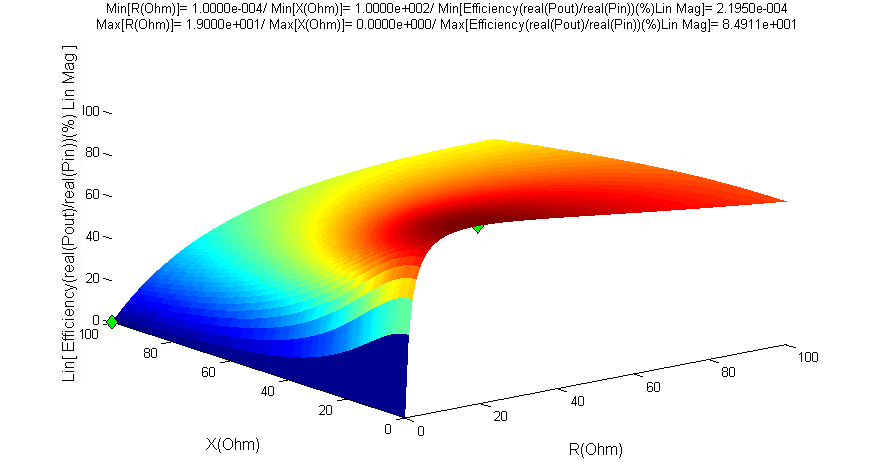
Sweep Mode
Select 3D:Sweep R & X (Fix Freq).
Frequency
Set Fix Frequency to 6.78 MHz.
Trace Parameter
Select Efficiency(real(Pout)/real(Pin))(%).
Calculation
Click Calculation, and wait for a computation.
Get insight from the figure.
Preset
Press Preset > OK to preset the analyzer.
Start WPT Analysis Software
Press Analysis > Start WPT Analysis.
Click OK.
Check User Advanced Mode and click Yes.
Stimulus/Sweep Setup
Press Center and input 6.78 MHz in entry bar.
Press Span and input 2MHz in entry bar.
Press Avg > IFBW and input 1 kHz in entry bar.
Calibration using ECal (e.g., N4433A) at the end of test cables
Press Cal > ECal > 2-Port Cal (same procedure as described in Demo#01).
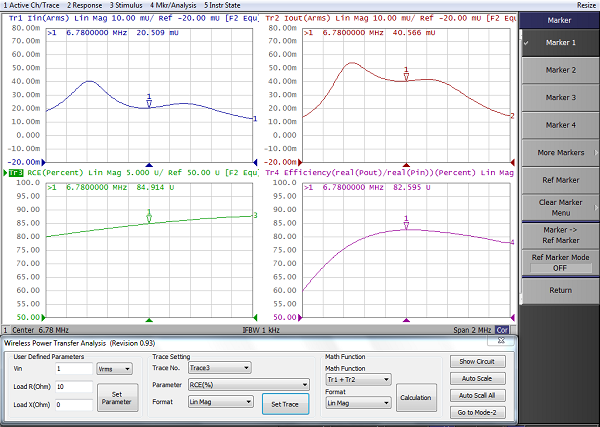
Setup for Measurement
Change Trace3 Parameter to RCE(%).
RCE stands for Resonator Coupling Efficiency; Optimum resonator coupling efficiency representing maximum power transfer efficiency between transmitting and receiving resonators.
Measurement
Connect DUT (Port1 and Port2).
Click Auto Scale All.
Data Analysis (Marker Function)
Click area on trace 4 or use Trace Prev/Trace Next to activate Tr4.
Press Marker and input 6.78 MHz in entry bar.
Read the marker value.
Marker can be moved by rotating the rotary knob.