Other topics about Data Analysis
You can easily determine the statistics data for a trace (mean, standard deviation, and peak-to-peak). The definitions for the statistics data elements are shown below. It is calculated within the marker search range.
|
Statistics data element |
Definition |
|
Mean (mean) |
|
|
Standard deviation |
|
|
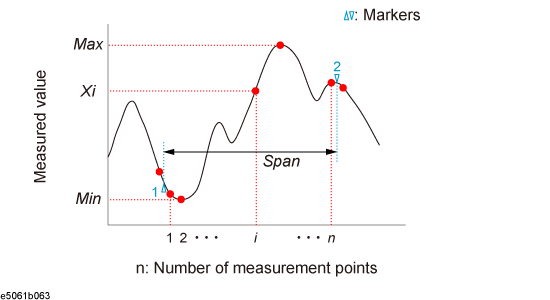
Peak-to-peak (p - p) |
Max - Min (Max: greatest measured value between markers 1 and 2.; Min: smallest measured value between markers 1 and 2.) |
The search range does not affect this result.
Press Channel Next (or Channel Prev) and Trace Next (or Trace Prev) to activate the trace of which the statistical data is required.
Press Marker Fctn > Statistics to turn ON the display of statistics data.
The markers 1 and 2 are activated automatically. Move markers 1 and 2 to the position of the measurement.