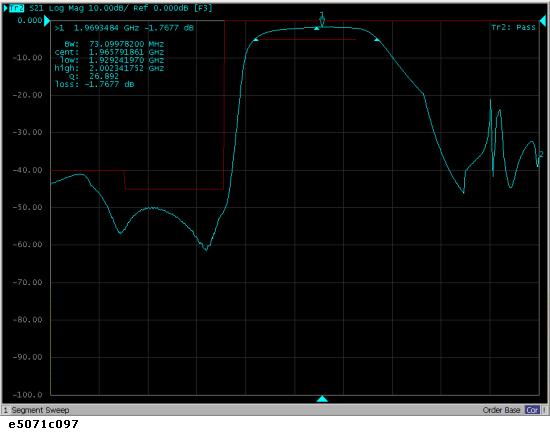
This section illustrates how to evaluate a duplexer (Tx center frequency: 1.88 GHz, Rx center frequency: 1.96 GHz).
Here, the DUT is evaluated by following the steps described in table below.
|
Steps |
Description |
|
Segment sweep conditions are determined according to the characteristics of the DUT. |
|
|
The segment sweep conditions are entered in the E5071C. |
|
|
The segment sweep is selected as the sweep type. |
|
|
A full 3-port calibration is executed by using the 2-port ECal module. |
|
|
The DUT is connected. |
|
|
The number of traces to be displayed, split display, and measurement parameters are specified. |
|
|
A trigger is applied to execute the measurement. |
|
|
The setup for segment display and for the scale are defined. |
|
|
The evaluation parameters for the duplexer are determined. |
|
|
The setup for the limit table is defined. |
|
|
The limit test is executed. |
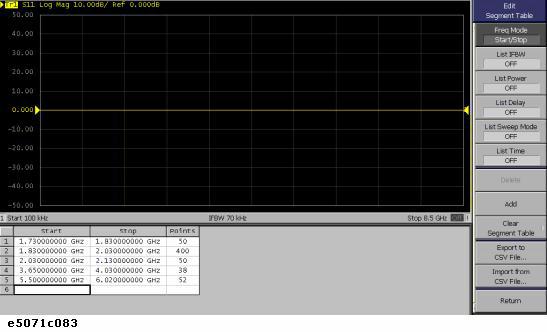
A segment sweep is performed by following the sweep conditions shown in table below.
|
Start |
Stop |
Number of Points |
|
1.73 GHz |
1.83 GHz |
50 |
|
1.83 GHz |
2.03 GHz |
400 |
|
2.03 GHz |
2.13 GHz |
50 |
|
3.65 GHz |
4.03 GHz |
38 |
|
5.5 GHz |
6.02 GHz |
52 |
Entries are made in the segment sweep table following the steps described below.
1. Display the segment table.
|
Setup Description |
Key Operation |
|
Presetting |
Preset > OK |
|
Displaying the segment table |
Sweep Setup > Edit Segment Table |
2. Enter the setup data in the segment sweep table.
In this step, the IF Bandwidth, power level, delay time, and sweep time are not entered segment by segment. By turning off the display of those parameters on the segment table, you can use, in each segment without making a change:
the IF Bandwidth (preset value: 70 kHz) of the channel specified by using Avg > IF Bandwidth
Power level (preset value: 0 dBm) of the channel specified by using Sweep Setup > Power
Sweep delay time (preset value: 0 sec) of the channel specified by using Sweep Setup > Sweep Delay
Sweep mode (preset value: Stepped mode) of the channel specified by using Sweep Setup > Sweep Mode
Sweep time (preset value: Automatic) of the channel specified by using Sweep Setup > Sweep Time.

The segment sweep is selected as the sweep type.
|
Setup Description |
Key Operation |
|
Sweep type: Segment sweep |
Focus (Moves the focus to the softkey menu) > Return > Sweep Type > Segment |
In this step, a 2-port ECal module and 3-/4-port module installed in the E5071C are used to execute calibration on the three ports used in the measurement.
Connect the USB port of the 2-port ECal module and the USB port of the E5071C with a USB cable. The connection may be made while the unit is powered.
Load and execute the 3-/4-port ECal programs.
|
Setup Description |
Key Operation |
|
Opening the VBA Project Open dialog box |
Macro Setup > Load Project |
|
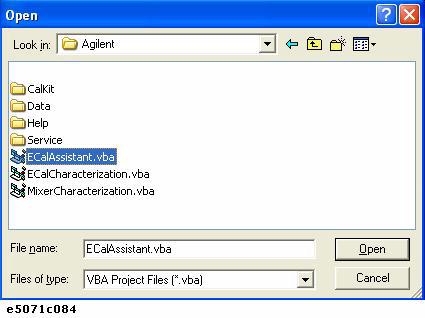
Loading ECalAssistant.VBA
|
Select D:\Agilent\ECalAssistant.VBA and press the Open button. |
|
Executing the program |
Macro Run |
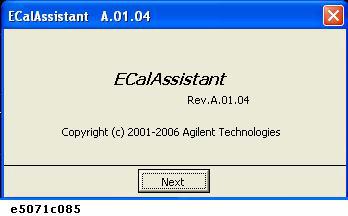
The EcalAssistant (start) dialog box appears.
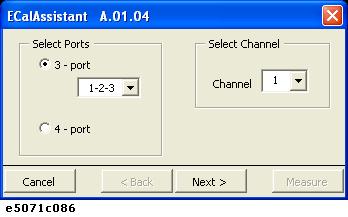
Click Next to display the EcalAssistant (port/channel selection) dialog box.
Following the instructions in the dialog box, select the type of ECal, test ports, and the channel.
|
Setup Description |
Key Operation |
|
Select Ports |
|
|
ECal type: Full 3-port calibration |
3 Port |
|
Test ports to be used for ECal: 1, 2, and 3 |
1, 2, 3 |
|
Select Channel |
|
|
Channel on which ECal is to be executed: Channel 1 |
Channel: 1 |
Click Next. The EcalAssistant (connection) dialog box appears. Select 3-port/Channel:1.
Connecting the ECal module
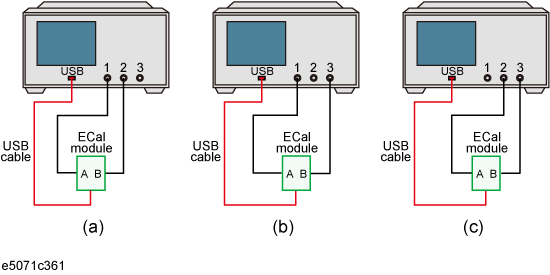
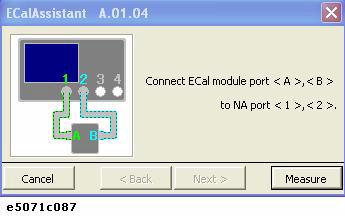
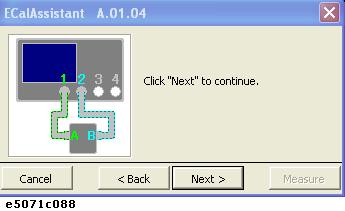
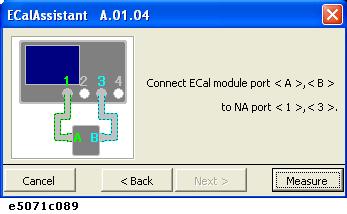
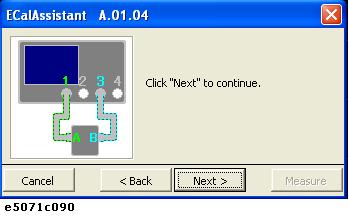
Click Next. The dialog box for the calibration of port 2-3 appears.
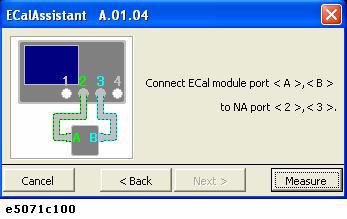
Click Measure to Calibrate Port 2-3 settings. After successful calibration of Port 2-3, a new dialog box appears.
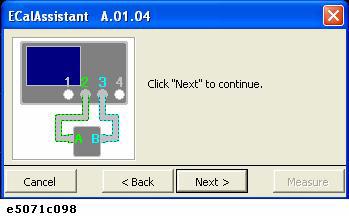
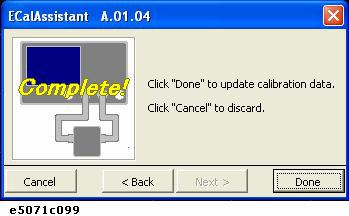
The EcalAssistant (complete) dialog box appears. Click Done to terminate the calibration.
ECalAssistant (complete) dialog box
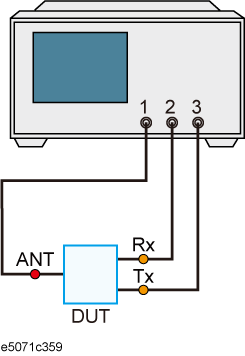
The DUT is connected to test ports 1, 2, and 3.
The setup for display is defined.
|
Setup Description |
Key Operation |
|
Number of traces to be displayed: 5 |
Display > Number of Traces > 5 |
|
Trace placement: Trisected |
Allocate Traces > |
|
Measurement Parameter |
|
|
Trace 1: S13 |
Meas - S13 |
|
Trace 2: S21 |
Trace Next > Meas > S21 |
|
Trace 3: S23 |
Trace Next > Meas > S23 |
|
Trace 4: S33 |
Trace Next > Meas > S33 |
|
Trace 5: S11 |
Trace Next > Meas > S11 |
A trigger is applied to execute the measurement.
|
Setup Description |
Key Operation |
|
Trigger mode: Single (or continuous) |
Trigger > Single (or Continuous) |
The setup for the scale is defined.
|
Setup Description |
Key Operation |
|
Segment display: Order base |
Sweep Setup > Segment Display > Order Base |
|
Reference Line Position |
|
|
Trace 1: 10 |
Trace Next > Scale > Reference Position > 1 > 0 > x1 |
|
Trace 2: 10 |
Trace Next > Reference Position > 1 > 0 > x1 |
|
Trace 3: 10 |
Trace Next > Reference Position > 1 > 0 > x1 |
|
Trace 4: 9 |
Trace Next > Reference Position > 9 > x1 |
|
Trace 5: 9 |
Trace Next > Reference Position > 9 > x1 |
Measurement result (segment display: order base)
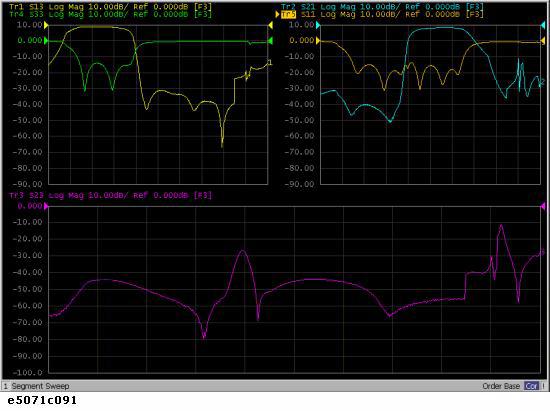
The parameters for the duplexer are determined.
1. Determine the insertion loss and 3-dB bandwidth for Tx.
|
Setup Description |
Key Operation |
|
Marker coupling: OFF |
Marker Fctn > Couple (Turn it OFF) |
|
Activating Trace 1 |
Trace Next |
|
Marker 1: ON |
Marker |
|
Search/Tracking: ON |
Marker Search > Tracking (Turn it ON) |
|
Moving the marker 1 to the trace maximum |
Max |
|
Bandwidth search: ON |
Bandwidth (Turn it ON) |
The insertion loss (loss) in this example is -1.243 dB, and the 3-dB bandwidth (BW) is 85.53 MHz.
2. Determine the insertion loss and 3-dB bandwidth for the Rx.
|
Setup Description |
Key Operation |
|
Activating Trace 2 |
Trace Next |
|
Marker 1: ON |
Marker |
|
Search/Tracking: ON |
Marker Search > Tracking (Turn it ON.) |
|
Moving Marker 1 to the trace maximum |
Max |
|
Bandwidth search: ON |
Bandwidth (Turn it ON) |
The insertion loss (loss) in this example is -1.627 dB and the 3-dB bandwidth (BW) is 71.04 MHz.
3. Determine the isolation between Tx and Rx.
|
Setup Description |
Key Operation |
|
Activating Trace 3 |
Trace Next |
|
Marker 1: ON |
Marker |
|
Search/Tracking: ON |
Marker Search > Tracking (Turn it ON) |
|
Moving Marker 1 to the peak near 1.92 GHz |
Peak - Search Left or Search Right ( press as many times as necessary) |
The isolation (response value of marker 1) in this example is -6.612 dB.
4. Determine the return loss of Tx.
|
Setup Description |
Key Operation |
|
Activating Trace 4 |
Trace Next |
|
Marker 1: ON |
Marker |
|
Search/Tracking: ON |
Marker Search > Tracking (Turn it ON) |
|
Moving Marker 1 to the peak in the pass band |
Peak > Search Left or Search Right ( press as many times as necessary) |
The return loss (response value of Marker 1) in this example is 12.65 dB.
5. Determine the return loss of Rx.
|
Setup Description |
Key Operation |
|
Activating Trace 5 |
Trace Next |
|
Marker 1: ON |
Marker |
|
Search/Tracking: ON |
Marker Search > Tracking (Turn it ON) |
|
Moving Marker 1 to the peak in the pass band |
Peak > Search Left|Search Right ( press as many times as necessary) |
The return loss (response value of Marker 1) in this example is 13.80 dB.
6. Turn on the marker table display.
|
Setup Description |
Key Operation |
|
Marker table display: ON |
Marker Fctn > Marker Table (Turn it ON) |
Activating Marker Table
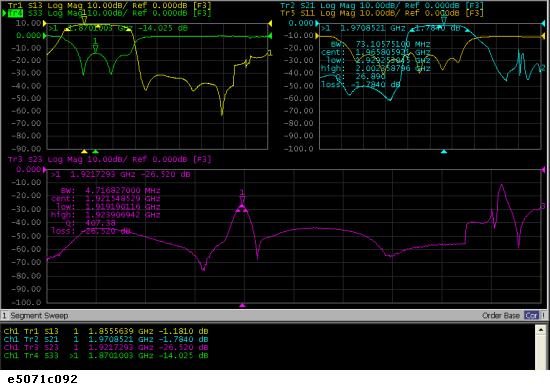
Follow the steps below to make entries in the limit table.
1. Display the limit table for Trace 1 (S13).
|
Setup Description |
Key Operation |
|
Activating Trace 1 |
Trace Next |
|
Displaying a limit table |
Analysis > Limit Test > Edit Limit Line |
2. Enter the setup data in the limit table for trace 1.
Completed limit table for trace 1

3. Display the limit table for Trace 2 (S21).
|
Setup Description |
Key Operation |
|
Activating Trace 2 |
Trace Next |
4. Enter the setup data in the limit table for trace 2.
Completed limit table for trace 2

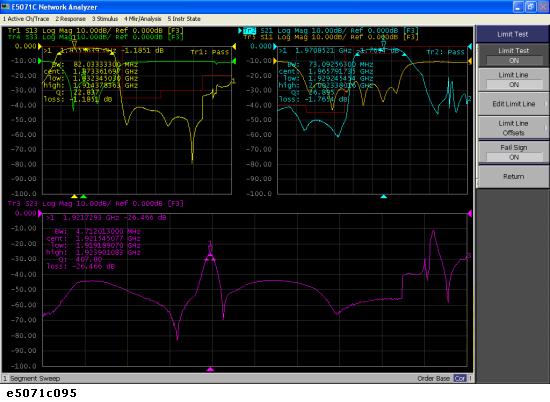
The limit test is executed.
1. Turn on the limit line and limit test for Trace 1.
|
Setup Description |
Key Operation |
|
Activating Trace 1 |
Trace Prev |
|
Limit Line: ON |
Analysis > Limit Test - Limit Line (Turn it ON) |
|
Limit Test: ON |
Limit Test (Turn it ON) |
2. Turn on the limit line and limit test for Trace 2.
|
Setup Description |
Key Operation |
|
Activating Trace 2 |
Trace Next |
|
Limit Line: ON |
Limit Line (Turn it ON) |
|
Limit Test: ON |
Limit Test (Turn it ON) |
3. Apply a trigger to execute the measurement.
|
Setup Description |
Key Operation |
|
Trigger Mode: Single |
Trigger > Single (or Continuous) |
Limit test results
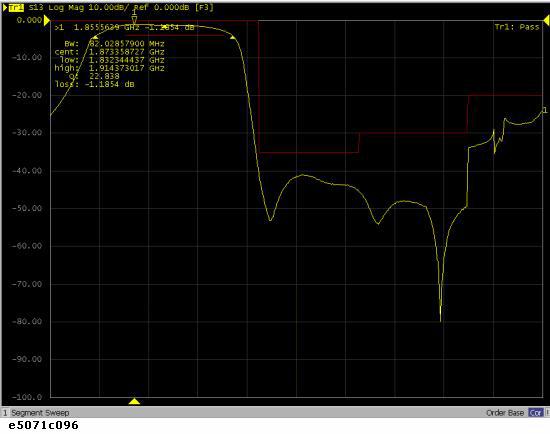
4. Maximize the screen display of Trace 1 to examine its details.
|
Setup Description |
Key Operation |
|
Activating Trace 1 |
Trace Prev |
|
Maximizing the display of Trace 1 |
Trace Max |
Enlarged display of trace 1
5. Maximize the screen display of Trace 2 to examine its details.
|
Setup Description |
Key Operation |
|
Activating Trace 2 |
Trace Prev (The display of Trace 2 is maximized.) |
Enlarged display of trace 2
