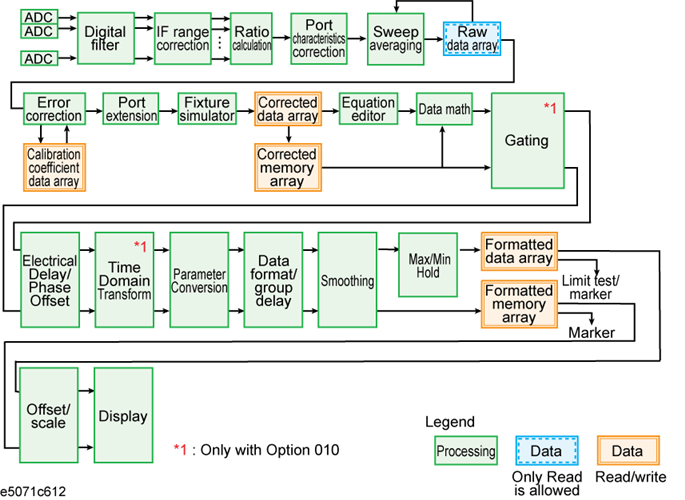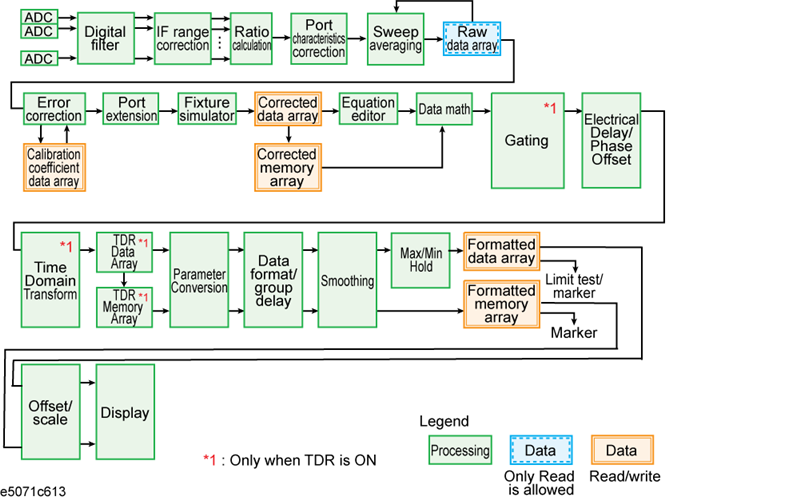
The internal data processing flowchart for the E5071C is shown in the following figure.

Data Processing Flowchart (Option TDR)

The ADCs (analog-to-digital converters) convert analog signals fed to the receiver and converted into IF signals (R1, R2, .... , Rn and T1, T2, .... , Tn) into digital signals. One ADC is available for each signal and the conversion takes place simultaneously.
The digital filter performs a discrete Fourier transformation (DFT) and picks up IF signals. Each IF signal is then converted into a complex number that has a real part and an imaginary part. The IF bandwidth of the analyzer is equivalent to the bandwidth of the DFT filter. The IF bandwidth can be set in the range of 10 Hz ~ 100 kHz.
Input signals that went through ranging at the receiver are reverted (corrected) to previous values before the ranging.
The ratio between two signals is determined by performing divisions on complex numbers. In the case of absolute measurements (Option 008), the ratio of complex number can not be calculated.
The equivalent source match error, the directivity error, and the tracking error of each test port bridge are corrected. In the case of absolute measurements (Option 008), the gain of each test port is corrected.
The average of complex indices is determined based on data obtained from multiple sweep measurements. Sweep averaging is effective in reducing random noise in measurements.
The results from all data processing done up to this point are stored in this array as raw data. All prior data processing is performed as each sweep takes place. When the full N-port error correction (N=2 to 4) is enabled, all N × N S parameters are stored in the raw data array and used in error correction. Users are allowed to access (read only) this raw data array.
When error correction is enabled, the process eliminates the system errors that are reproducible and stored in the calibration coefficient data array. It accommodates everything from the simple vector normalization to the full 12-term error correction. The user is allowed to access (read/write) this calibration coefficient data array. Gain correction is performed in absolute measurement.
This process carries out a simulation of adding or eliminating a variable length no-loss transmission path on each test port so that the reference plane of calibration is moved. The port extension is defined by an electrical delay (sec).
A data conversion by the fixture simulator function is executed. The fixture simulator function is a collective term for six different functions: balanced-unbalanced conversion, addition of matching circuits, port reference impedance conversion, network elimination, addition of differential matching circuits, and differential reference impedance conversion.
Unlike the raw data array, this array stores the results obtained after error corrections, port extensions, or the fixture simulator functions are applied. The user is allowed to read/write data from/to the corrected data array.
By pressing Display > Data -> Mem, the contents of the corrected data array will be copied to this array. The user is allowed to read/write data from/to the corrected memory array.
Equation Editor is a function available in Firmware revision A.08.0x or later that allows users to use a custom equation to display data in the E5071C. Equation Editor can be accessed through Display > Equation Editor.
Data processing is carried out using the corrected data array and the corrected memory array. Four types of data processing addition, subtraction, multiplication, and division are available.
An electrical delay and a phase offset are applied to each trace. By setting an electrical delay, a linear phase that is proportional to the frequency will be added or subtracted. On the other hand, setting a phase offset adds or subtracts a phase that is constant throughout the frequency range. Incidentally, data processing performed from this point on in the flowchart is applied to both the data array and the memory array.
The results from all data processing done up to this point are stored in this array. The user is not allowed to access (read/write) this data array.
By pressing Display > Data -> Mem, the contents of the TDR data array will be copied to this array. The user is not allowed to access (read/write) this memory array.
Complex data consisting of the real parts and the imaginary parts are converted into scalar data according to the data format of user's choice. Group delays are also calculated here.
By enabling the smoothing function, each point in a sweep measurement will be replaced by a moving average of several measurement points nearby. The number of points used in calculating a moving average is determined by the smoothing aperture set by the user. The smoothing aperture is defined by a percentage against the sweep span.
All results from data processing are stored in the formatted data array and the formatted memory array. The marker functions are applied to these arrays. The limit test is applied to the formatted data array. The user is allowed to read/write data from/to these arrays.
Each set of data is processed so that traces can be drawn on the screen. Particular scaling depending on the data format is applied using the position of the reference line, the value of the reference line, and the scale/graticule settings.
The results obtained after data processing are displayed on the screen as traces.
Other topics about General Principles of Operation