Measurement Example of a Bandpass Filter
This section describes how to measure the transmission characteristics of a 947.5 MHz bandpass filter. The measurement conditions for this measurement example are those suitable for a 947.5 MHz bandpass filter. To measure another device under test (DUT), change the measurement conditions to suit the particular DUT.
STEP 1. Determining Measurement Conditions
-
Preset the E5072A.
Preset > OK
-
Set the S-parameter to S21.
Meas > S21
-
When measuring the reverse transmission characteristics, set the S-parameter to S12.
-
Set the data format to the log magnitude format
Format > Log Mag
-
Set the center frequency to the bandpass filter center frequency. Next, specify the span frequency, which is set to 200 MHz in this measurement example.
Center > 9 > 4 > 7 >. 5 > M/m
Span > 2 > 0 > 0 > M/m
-
When entering the frequency unit using the keyboard, type "G" for GHz, "M" for MHz, and "k" for kHz.
-
Specify the number of measurement points per sweep. The number of measurement points in this measurement example is set to 401.
Sweep Setup > Points > 4 > 0 > 1 > x1
-
Specify the power level of the signal source. The power level in this measurement example is set to -10 dBm.
Sweep Setup > Power > +/- > 1 > 0 > x1
-
Specify the IF bandwidth of the receiver as necessary. In this measurement example, the IF bandwidth is set to 10 kHz because of the need to lower the noise floor.
Avg > IF Bandwidth > 1 > 0 > k/m
STEP 2. Calibration
To turn the error correction ON, set the calibration type to the full 2-port calibration and measure the calibration data.
For details about calibration, see Calibration.
-
Select the calibration kit suitable for the measurement cable. In this measurement example, Calibration Kit 85032F is selected.
Cal > Cal Kit > 85032F
-
Set the calibration type to the full 2-port calibration using the test port 1 and 2.
Cal > Calibrate > 2-Port Cal > Select Ports - 1-2
-
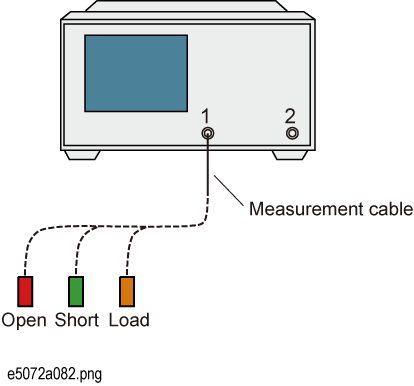
Connect the OPEN standard (included in the calibration kit) to the other end of the measurement cable that is connected to the test port 1 as shown in the following figure, and measure the open calibration data at the test port 1. After measuring the open calibration data, a checkmark  is displayed to the left of the Port 1 Open menu.
Cal > Calibrate > 2-Port Cal > Reflection > Port1 Open
In the same way, measure the calibration data for the SHORT/LOAD standards at the test port 1.
Connecting the OPEN/SHORT/LOAD standards
-
In the same way as described above, measure the calibration data for the OPEN/SHORT/LOAD standards at the test port 2.
-
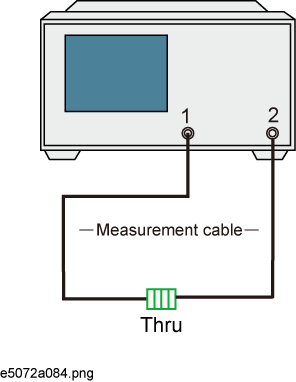
Connect the THRU standard (included in the calibration kit) between the measurement cables as shown in the figure below , and measure the thru calibration data. After measuring the thru calibration data, a checkmark appears is displayed to the left of the Port 1-2 Thru button.
Cal > Calibrate > 2-Port Cal > Transmission > Port 1-2 Thru
Connecting the THRU standard
-
Confirm that the full 2-port calibration measurements are completed. The calibration factor is calculated based on the calibration data acquired, and the error correction is turned ON.
Cal > Calibrate > 2-Port Cal > Done
-
Select the type in which the data is to be saved before saving the calibration factor (calculated based on the calibration data).
Save/Recall > Save Type > State & Cal
-
Store the calibration file to the disk of the E5072A. The symbol "X" appearing in the operations below represent the assigned numbers to be used when the file is saved.
Save/Recall > Save State > State 0X
STEP 3. Connecting the Device Under Test (DUT)
-
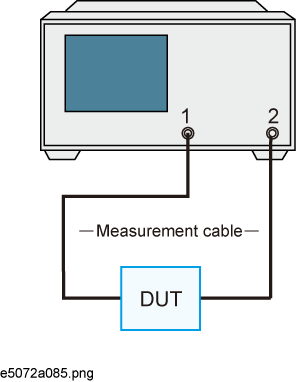
Connect to the DUT to the E5072A. (See the below figure)
Connecting the DUT
-
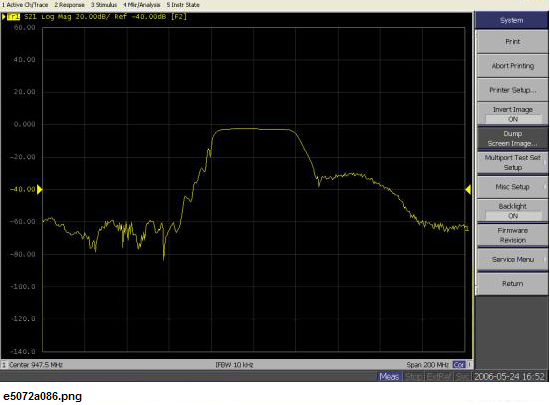
Set the appropriate scale by executing the auto scale. (See the below figure)
Scale > Auto Scale
You can also adjust the scale by entering arbitrary values in the Scale/Div button, Reference Position button, and Reference Value.
S21 trace after executing the auto scale
STEP 4. Analyzing Measurement Results
This section describes how to use the marker function to read out important parameters for the transmission measurement of the bandpassfilter (insertion loss, -3 dB bandwidth).
Measuring the Insertion Loss
-
Display a marker.
Marker > Marker 1
-
Using one of the following methods, move the marker to the center frequency of the bandpass filter.
-
On the entry bar, press 9> 4 > 7 > . > 5 > M/m
-
Turn the rotary knob  on the front panel to set it to the center frequency (947.5 MHz).
-
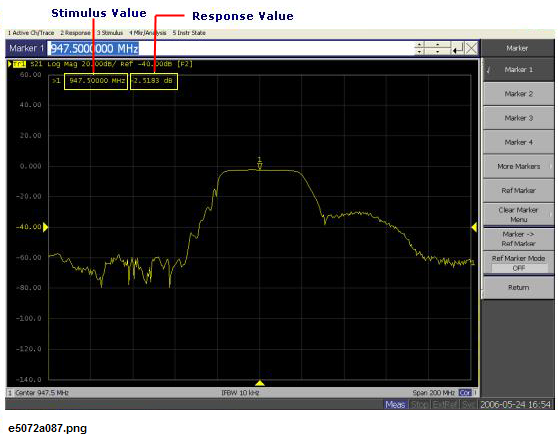
Read the marker value displayed as shown in the figure below. In this example, the response value denotes the insertion loss.
Measuring an Insertion Loss
Measuring the -3 dB Bandwidth
Using the marker bandwidth search function, the bandwidth, center frequency between two cutoff frequency points, Q value, and insertion loss are all read out. These parameters are described in the following table.
- Display a marker.
Marker > Marker 1
-
Using one of the following methods, move the marker to the center frequency of the bandpass filter.
-
On the entry bar, press 9 > 4 > 7 > . > 5 > M/m
-
Turn the rotary knob on the front panel to set it to the center frequency (947.5 MHz).
-
Specify a bandwidth value that defines the pass band of the filter. In this measurement example, it is set to -3 dB.
Marker Search > Bandwidth Value > +/- > 3 > x 1
-
Set the bandwidth search function ON.
Marker Search > Bandwidth
-
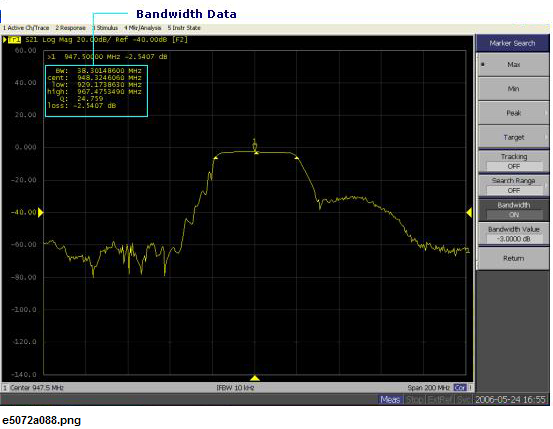
The bandwidth data items (BW, cent, low, high, Q, loss) will be displayed. (See the following figure)
Measuring the -3 dB Bandwidth
STEP 5. Outputting Measurement Results (Save)
You can save not only the internal data but also the measurement results such as trace data and display screens to the disk .
Saving the Trace Data(in CSV format)
You can save the trace data to the disk of the E5072A in CSV file format (extension: .csv). Since the CVS-formatted data to be saved is a text file, you can analyze the data using Microsoft Excel.
Follow the step below to save the trace data:
Save/Recall > Save Trace Data
Saving the Display Screen
You can save the screen displayed on the E5072A to the disk of the E5072A in Windows bitmap file format (extension: .bmp) or Portable Network Graphics format (extension: .png).
Follow the step below to save the display screen:
System > Dump Screen Image