Channel Studio TDL
The Graph pane provides a visual representation of the fading parameters currently configured in the Channel Studio TDL application.
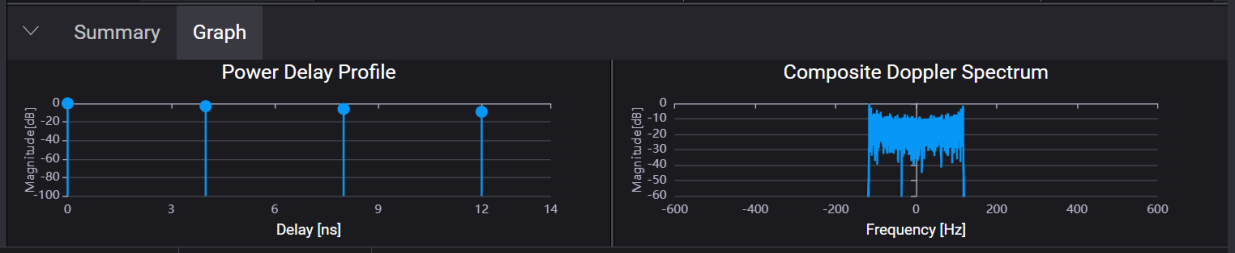
It includes the Power Delay Profile and Composite Doppler Spectrum plots, helping you to analyze the time and frequency characteristics of the fading model, at a glance.
This graph shows paths used in the fading profile as a delay vs. magnitude. All paths are presented in the same graph. For example, the Power Delay Profile graph in the figure below shows four paths.
This graph shows the doppler spectrum that is achieved with the configured fading profile.