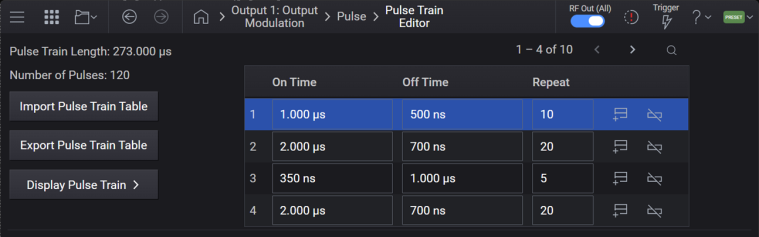
Creating and Editing a Pulse Train Using Pulse Train Editor
Plotting and Viewing Pulse Train
SCPI Descriptions for Pulse Train
Using the Pulse Train Editor, you can:
Edit the pulse train data.
Import and export pulse trains as csv (comma separated values) or binary files format.
Plot and view the pulse train data using the pulse train chart.
In a pulse train, you can specify up to 2047 independent pulse cycles, each of which has an “On Time”, during which the RF output is measurable at the RF output connector, and an "Off Time", during which the RF output is attenuated. There are also repeat counts available for each pulse.
For licensing requirements, refer to Output Modulation > Pulse and Pulse Type > Pulse Train.
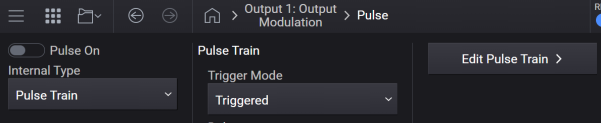
In the Output Modulation > Pulse screen, select Pulse Train as the Pulse Type.
Click Edit Pulse Train.
In the Pulse Train Editor, create the pulse train entries by:
Either manually entering the pulse train data in the displayed table.
On Time (On time for each pulse cycle (element) in the pulse train.)
Off Time (Off times for each pulse cycle (element) in the pulse train.)
Repeat (repeat count for each pulse cycle (element) in the pulse train.)
Use  to add pulses or
  to delete pulses until you have defined the complete pulse sequence you want.
Or importing pulse train data from a CSV file.
Click Import Pulse Train Table and then browse to select the required .csv file or the legacy .ptrain binary file (for MXG-B backward compatibility).
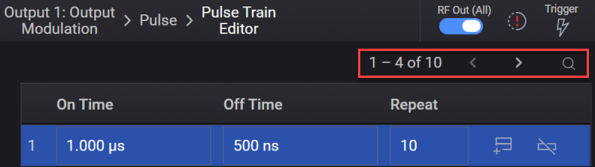
For large pulse trains, you may navigate/review the pulse entries in the table by:
Using the paginator to move between pages of pulse rows.
Using the search in paginator to jump to a specific pulse row index.
Once you have defined the pulse train, you can visually validate the pulse train using the Display Pulse Train option.
In the Output Modulation > Pulse screen, select Pulse Train as the Pulse Type.
Click Edit Pulse Train.
In the Pulse Train Editor, click Display Pulse Train.
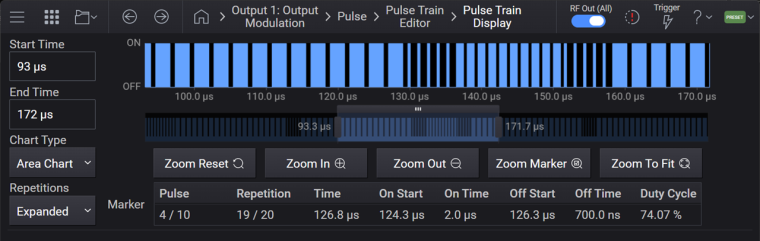
From the Repetitions listbox, choose whether you want the pulse repetitions to be shown as collapsed or expanded in the pulse train chart. These repetitions are set using the Repeat setting in the Pulse Train table.
You can use the following chart controls to optimize the view of the pulse train chart.

You can use the data zoom slider under the pulse train chart and drag the slider handles to zoom/pan or click in the slider to center the zoom region.
You can move the marker by hovering the mouse /touching inside the pulse train chart. The marker values are then displayed in the Marker information table at the bottom of the display.
See pulse train for SCPI descriptions.