 Setup
SetupAccesses capabilities performed in the factory or under instructions from repair procedures.
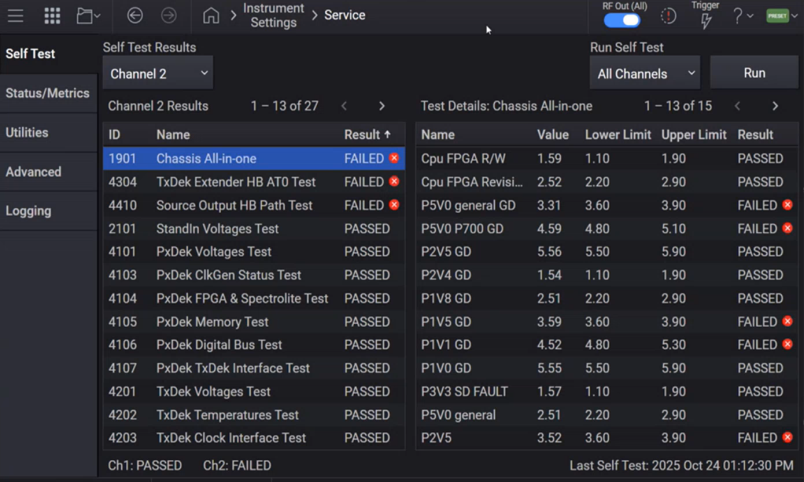
Selecting All Channels from the Run Self Test listbox followed by Run displays diagnostic information for the instrument based on channels.
For information on running the self test using SCPI, see *TST? - Self Test Query
|
GUI Location |
System Menu (triple bar icon) > Settings (gear icon) > Service > Self Test > Run Self Test > All Channels |
Running Self Test takes at least five minutes to complete.
Query only
Performs the internal self-test routines for a specified RF Channel and returns a number indicating the success of the testing. A zero is returned if the test is successful, 1 if it fails.
|
GUI Location |
System Menu (triple bar icon) > Settings (gear icon) > Service > Self Test > Run Self Test > Channel <n> |
|
SCPI Command |
:SYSTem:RF<channel>:STESt? |
|
SCPI Example |
SYST:RF3:STESt? !Runs the self-test routines for RF Channel 3 and returns 0=passed, 1=some part failed. |
|
Notes |
SYSTem:RF<channel>:STESt? May take many minutes to complete, set timeout value on controlling test program to a very large value (e.g. 10 minutes). Successful completion of self-test on the channel will clear the applicable bit in the STATus:QUEStionable:STFailed or STATus:QUEStionable:STFailed:ESTFailed register. Unsuccessful completion of self-test on the channel will set the applicable bit in the STATus:QUEStionable:STFailed or STATus:QUEStionable:STFailed:ESTFailed register. |
Performs the internal self-test routines for a specified test on a specified RF channel and returns a number indicating the success of the testing. 0 is returned if the test is successful, 1 if it fails.
Use the GUI to specify the following:
RF Channel to test on
Specific Self Test to run
Number of test Runs
|
GUI Location |
System Menu (triple bar icon) > Settings (gear icon) > Service > Self Test > Run Self Test > Selected Test |
|
SCPI Command |
No SCPI, GUI only |
Performs the internal self-test routines for all failed tests across all RF Channels and returns a number indicating the success of the testing. 0 is returned if the test is successful, 1 if it fails.
|
GUI Location |
System Menu (triple bar icon) > Settings (gear icon) > Service > Self Test > Run Self Test > All Failed Tests |
|
SCPI Command |
No SCPI, GUI only |
Specifies the number of times to run a specific self-test on a specified channel.
|
GUI Location |
System Menu (triple bar icon) > Settings (gear icon) > Service > Self Test > Runs |
|
SCPI Command |
No SCPI, GUI only |
Allows aborting self-test runs whenever more than one test or multiple runs of the same test are run.
|
GUI Location |
System Menu (triple bar icon) > Settings (gear icon) > Service > Self Test > Run > Abort |
|
SCPI Command |
No SCPI, GUI only |
Remote command only.
Enables logging for all channels during self tests execution. Logs files will be saved at:
CalTestLogs
|
SCPI Command |
:SYSTem:STESt:LOG ON|OFF|1|0 :SYSTem:STESt:LOG? |
|
SCPI Example |
SYST:STES:LOG ON SYST:STES:LOG? |
| Preset | ON |
|
State Saved |
No |
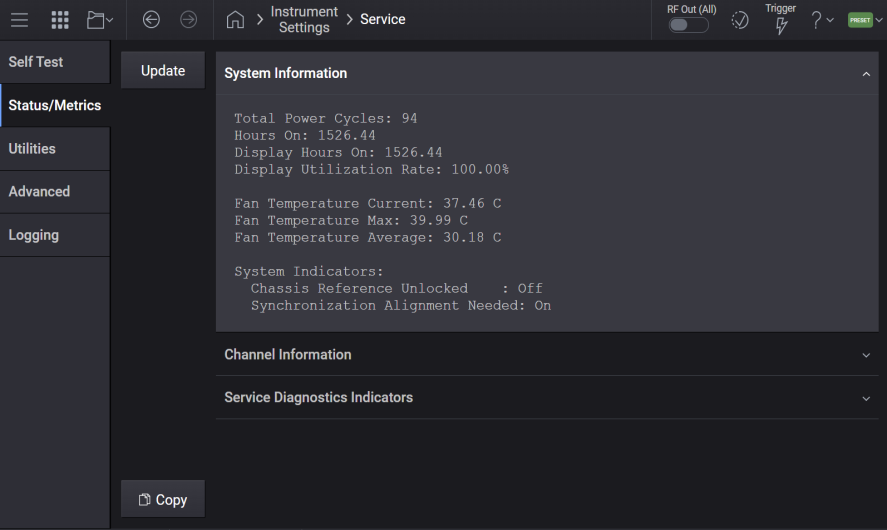
The Status / Metrics tab displays temperatures and other information for the instrument when you click Update.
|
GUI Location |
System Menu (triple bar icon) > Settings (gear icon) > Service > Status / Metrics |
Copy simply copies this information to the clipboard for pasting into Windows programs.
Query only.
Returns the cumulative number of hours the signal generator has been on.
|
GUI Location |
System Menu (triple bar icon) > Settings (gear icon) > Service > Status / Metrics |
|
SCPI Command |
:DIAGnostic[:CPU]:INFormation:OTIMe? |
|
SCPI Example |
:DIAG:INF:OTIM? |
Query only.
Returns the cumulative number of hours the display has been on.
|
GUI Location |
System Menu (triple bar icon) > Settings (gear icon) > Service > Status / Metrics |
|
SCPI Command |
:DIAGnostic[:CPU]:INFormation:DISPlay:OTIMe? |
|
SCPI Example |
:DIAG:INF:DISP:OTIM? |
Query only.
Returns the temperature of the instrument. This information is also displayed on the Service, Status screen.
|
GUI Location |
System Menu (triple bar icon) > Settings (gear icon) > Service > Status / Metrics |
|
SCPI Command |
:SYSTem:TEMPerature? |
|
SCPI Example |
SYST:TEMP? |
|
Notes |
Value returned is in degrees Celsius. |
Query only.
Returns the instrument's airflow temperature.
For N5185A/N5186A, this setting measures the temperature of the air coming into the instrument.
|
GUI Location |
System Menu (triple bar icon) > Settings (gear icon) > Service > Status / Metrics |
|
SCPI Command |
:SYSTem:TEMPerature:FAN? |
|
SCPI Example |
SYST:TEMP:FAN? |
|
Notes |
Value returned is in degrees Celsius. |
| Backwards Compatibility SCPI |
:SYSTem:TEMPerature:EXHaust? |
Query only.
Returns the maximum fan airflow temperature recorded for the instrument.
|
GUI Location |
System Menu (triple bar icon) > Settings (gear icon) > Service > Status / Metrics |
|
SCPI Command |
:SYSTem:TEMPerature:FAN:MAXimum? |
|
SCPI Example |
SYST:TEMP:FAN:MAX? |
|
Notes |
Value returned is in degrees Celsius. |
Query only.
Returns the average fan airflow temperature recorded for the instrument, where the exhaust temperature is measured once an hour.
|
GUI Location |
System Menu (triple bar icon) > Settings (gear icon) > Service > Status / Metrics |
|
SCPI Command |
:SYSTem:TEMPerature:FAN:AVERage? |
|
SCPI Example |
SYST:TEMP:FAN:AVER? |
|
Notes |
Value returned is in degrees Celsius. |
When monitoring the instrument’s temperature it is recommended to use the Instrument Temperature. For instruments with more than 1 channel, the ability to query an individual channel’s temperature is provided should you desire to monitor an individual channel.
|
GUI Location |
System Menu (triple bar icon) > Settings (gear icon) > Service > Status / Metrics |
|
SCPI Command |
:SYSTem:RF<channel>:TEMPerature? |
|
SCPI Example |
SYST:RF2:TEMP? |
|
Notes |
Value returned is in degrees Celsius. If the indicated <channel> doesn’t exist on the instrument, a timeout will occur. Ensure that you use this query only on the available channels of the instrument. |
Query only.
The instrument maintains proper instrument operation with the Fan Control set to Auto for the specified environmental conditions. If the instrument’s temperature becomes excessive, it may shut down. Thermal safe operating margin allows you to observe how close the current temperature is to the safety limit for a specified channel.
|
GUI Location |
System Menu (triple bar icon) > Settings (gear icon) > Service > Status / Metrics |
|
SCPI Command |
:SYSTem[:RF<channel>]:TEMPerature:OMARgin? |
|
SCPI Example |
SYST:TEMP:OMAR? |
|
Notes |
Value returned is in degrees Celsius. |
Query only.
The instrument maintains proper instrument operation with the Fan Control in Auto for the specified environmental conditions. If the instrument’s temperature becomes excessive, it may shut down. Minimum thermal safe operating margin reports the lowest ever Thermal Safe Operating Margin recorded for a specified channel.
|
GUI Location |
System Menu (triple bar icon) > Settings (gear icon) > Service > Status / Metrics |
|
SCPI Command |
:SYSTem[:RF<channel>]:TEMPerature:OMARgin:MINimum? |
|
SCPI Example |
SYST:TEMP:OMAR:MIN? |
|
Notes |
Value returned is in degrees Celsius. |
Query only.
Returns the cumulative number of hours the RF has been on.
|
GUI Location |
System Menu (triple bar icon) > Settings (gear icon) > Service > Status / Metrics |
|
SCPI Command |
:DIAGnostic[:CPU]:INFormation:CCOunt:OUTPut[:RF<channel>]:OTIMe? |
|
SCPI Example |
:DIAG:INF:CCO:OUTP:OTIM? |
Query only.
Calculates and returns the percentage of total system ON time during which the RF has been active, based on the cumulative number of hours.
|
GUI Location |
System Menu (triple bar icon) > Settings (gear icon) > Service > Status / Metrics |
|
SCPI Command |
:DIAGnostic[:CPU]:INFormation:CCOunt:OUTPut[:RF<channel>]:RATE? |
|
SCPI Example |
:DIAG:INF:CCO:OUTP:RATE? |
Query only.
Calculates and returns the percentage of total system ON time during which the display has been ON, based on the cumulative number of hours. This percentage is calculated from the values in the On Time History Query and Display On Time History settings.
|
GUI Location |
System Menu (triple bar icon) > Settings (gear icon) > Service > Status / Metrics |
|
SCPI Command |
:DIAGnostic[:CPU]:INFormation:CCOunt:DISPlay:RATE? |
|
SCPI Example |
:DIAG:INF:CCO:DISP:RATE? |
Query only.
Returns the cumulative number of times the signal generator has been powered on.
|
GUI Location |
System Menu (triple bar icon) > Settings (gear icon) > Service > Status / Metrics |
|
SCPI Command |
:DIAGnostic[:CPU]:INFormation:CCOunt:PON? |
|
SCPI Example |
:DIAG:INF:CCO:PON? |
Query only.
Returns the cumulative number of times the reverse power protection has been cycled for the specified channel.
|
GUI Location |
System Menu (triple bar icon) > Settings (gear icon) > Service > Status / Metrics |
|
SCPI Command |
:DIAGnostic[:CPU]:INFormation:CCOunt:PROTection[:RF<channel>]? |
|
SCPI Example |
:DIAG:INF:CCO:PROT? |
| Notes |
For N5185A and N5186A:
Otherwise:
|
Available when connected from a remote PC via a browser and the browser screen dimension are greater than 600 pixels high.
Pressing "Copy" copies the status and metrics information present in the GUI to the Clipboard for pasting into Windows programs.
|
GUI Location |
System Menu (triple bar icon) > Settings (gear icon) > Service > Status / Metrics > Copy |
|
SCPI Command |
No SCPI. GUI only. |
Selecting Utilities displays the available utilities for the installed modules.
|
GUI Location |
System Menu (triple bar icon) > Settings (gear icon) > Service > Utilities |
By default, the instrument dynamically adjusts the fan speed to provide the appropriate cooling for specified environmental conditions. You can override this automatic control by setting the fan to the maximum speed, in the event your environmental conditions are extreme.
If you set the fan to the maximum speed, it results in the loudest instrument operation.
|
GUI Location |
System Menu (triple bar icon) > Settings (gear icon) > Service > Utilities |
|
SCPI Command |
:SYSTem:FCONtrol AUTO|MAXimum :SYSTem:FCONtrol? |
|
SCPI Example |
SYST:FCON MAX |
|
Setup |
:SYSTem:PRESet:PERSistent |
| Post Setup |
:SYSTem:PRESet:PERSistent |
|---|---|
|
Dependencies |
Default value of AUTO is set by Restore System Defaults |
|
State Saved |
Persistent, survives preset and power cycle but not saved in the instrument state. |
GUI option only
The Generate Report button generates the .zip archive report containing a variety of system information and configuration files, including:
Log files
State files
Installed license files
Software and Hardware version information
These reports are intended for Keysight Support Engineers to assist in the diagnosis of undesirable instrument behaviors.
After the report is generated, you can copy the .zip archive report off the instrument.
If viewing the instrument interface from the instrument’s front panel, a QR code appears to copy the archive file to a QR-scanning device.
If accessing the instrument interface from the browser of a remote PC, the Download button appears to copy the file directly to the remote PC.
If a USB drive is attached, options appear to copy the archive file directly to the USB drive.
|
GUI Location |
System Menu (triple bar icon) > Settings (gear icon) > Service > Utilities |
GUI option only
You can use one of the following methods for selecting a .ctp file to update the firmware. The availability of these methods depend on how you are accessing the instrument.
| Method | Description |
| From this PC |
Allows uploading the firmware from the remote PC to the instrument via your browser. This method is available only when accessing the instrument from the browser of a remote PC. |
| From USB | Detects attached USB drives, searching the root of the drives for files with a .ctp extension. |
| From Instrument | Select a file that has already been uploaded to the instrument storage. |
|
GUI Location |
System Menu (triple bar icon) > Settings (gear icon) > Service > Utilities |
Log files are intended for Keysight Support Engineers to assist in diagnosis of undesirable instrument behaviors.
The Logging Configuration options allows for precise modifications to the log output. These modifications can be done utilizing logging presets or manually by adding and removing individual loggers via the Add Logger button.
GUI option only
This drop-down adds a specific logger to the logging configuration.
Once added, loggers can be removed individually via the Minus button in the table.
Modifying the verbosity of any specific logger, added by preset or otherwise, can be done at anytime with the provided drop-downs. Verbosity options from high to low are:
Trace
Debug
Info
Warn
Error
Critical
|
GUI Location |
System Menu (triple bar icon) > Settings (gear icon) > Service > Logging > Add Logger |
GUI option only
Save must be pressed before leaving the tab or all modifications will be lost. If the table is empty when Save is pressed, default logging behaviors will be restored.
|
GUI Location |
System Menu (triple bar icon) > Settings (gear icon) > Service > Logging > Save |
GUI option only
Adds preconfigured loggers to the logging configuration.
The simplest way to configure logging is to use one of the available presets via the Logging Presets drop-down. These presets are preconfigured to aid in diagnosis of specific categories of instrument behaviors, adding a subset of loggers at specific verbosity levels.
|
GUI Location |
System Menu (triple bar icon) > Settings (gear icon) > Service > Logging > Logging Presets |
GUI option only
Immediately adds a line to the log for future reference. The text of the line will be:
"[siggen.custom] [info] Log Flag"
|
GUI Location |
System Menu (triple bar icon) > Settings (gear icon) > Service > Logging > Write Log Flag |
GUI option only
Opens a log viewer for the most recent lines written to the log. This reads logs directly from file. Therefore, if a log file is manually deleted, this view will also be impacted. Options are available to change the number of lines displayed.
|
GUI Location |
System Menu (triple bar icon) > Settings (gear icon) > Service > Logging > View Logs |
If the instrument application stops running for any reason, a dialog appears with a link to show the Support Options menu. This menu provides options for support and recovery. The tools available in this menu are:
When updating firmware, firmware files cannot be selected from arbitrary locations on the instrument. USB is the primary and supported method for providing firmware files.