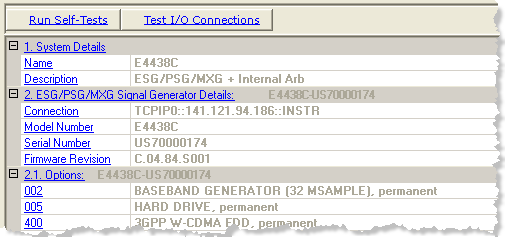
 property page
shows <Simulated Hardware> in the
cell and <Simulated (instrument type)> appears in the
cell. N/A
appears in most of the other cells.
 For information about using the software to change instrument settings:
for Arb, see Instrument
for real-time, see Instrument (EXG/MXG Real-Time Software)
Click Hardware in the tree view to display read-only information about the hardware.
When using a simulated instrument connection,
the  property page
shows <Simulated Hardware> in the
cell and <Simulated (instrument type)> appears in the
cell. N/A
appears in most of the other cells.

Click this button to run a test of the I/O interface connection between the instrument and the PC. performs the same tests as the button.
The Self-Tests  window
appears and displays the results of the tests. Closing the test dialog
window also closes the hardware node and opens the waveform setup node.
window
appears and displays the results of the tests. Closing the test dialog
window also closes the hardware node and opens the waveform setup node.
If an error occurs, a  red X
appears next to the failed test and an error message is displayed in the
status area.
Click this button to run a test of the I/O interface connection between the instrument and the PC. performs the same tests as the button.
The Test I/O Connections  window
appears and displays the results of the tests. Closing the test dialog
window also closes the hardware node and opens the waveform setup node.
window
appears and displays the results of the tests. Closing the test dialog
window also closes the hardware node and opens the waveform setup node.
If an error occurs, a  red X
appears next to the failed I/O connection and an error message is displayed
in the status area.
View the name assigned to the system.
View the hardware configuration type.
View connection details (LAN or GPIB).
View the instrument model number.
View the instrument serial number.
View the instrument firmware revision number.
View the options of the connected instrument. These cells are not displayed when using simulated hardware.