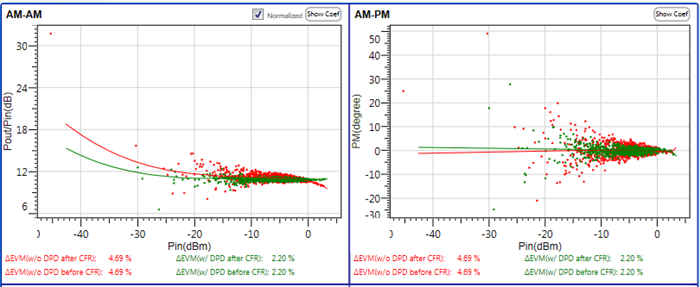
If Digital Predistortion is set to On, two curves will be displayed, with DPD and without DPD.
If Digital Predistortion is set to Off, only one curve will be displayed.
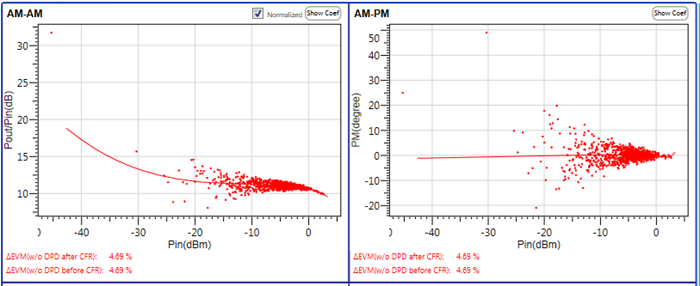
To get the AM-AM and AM-PM results, two signals are used. One is the reference signal, which is the PA input signal. The other is the PA output signal, for which the IQ waveform data is captured using the Signal Analyzer.
For AM-AM curve, you can click on the Normalized check box to choose whether to display the normalized results. You can also click the Show Coef button to show the coefficients used to fit the Am-AM and AM-PM curve.
If Digital Predistortion is set to On, two curves will be displayed, with DPD and without DPD.
If Digital Predistortion is set to Off, only one curve will be displayed.
The above graphs are captured with CFR set to On, so two sets of ∆EVM results (before/after CFR) are provided. If CFR is set to Pass Through, just one set of ∆EVM results will be provided.