With proper configuration, the PAPR of waveform can be suppressed to a specified level with certain damage.
Three general algorithms (“Peak Windowing”, “Clipping and Filtering” and “Peak Cancellation”,) are supported, which can be applied to IQ waveform of any wireless communicate formats (for example, LTE, WLAN, and so on).
See the following topics for more information about the user interface:
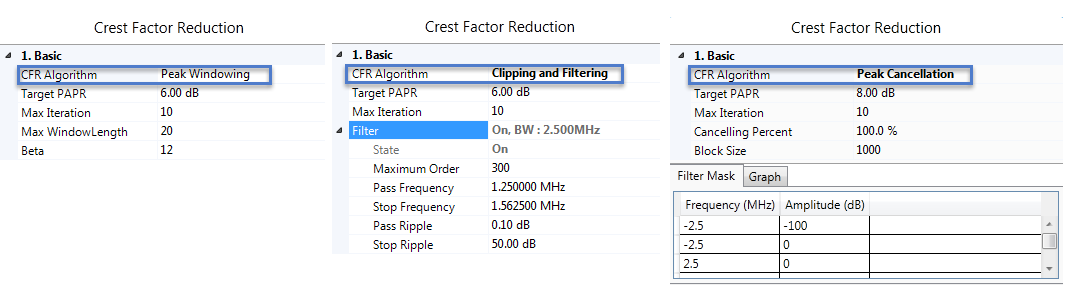
The settings of Crest Factor Reduction block will be different according to the setting of CFR algorithm as shown in the following figure (Left: CFR Algorithm is set to Peak Windowing; Middle: CFR Algorithm is set to Clipping and Filtering; Right: CFR Algorithm is set to Peak Cancellation).
|
|
||||||||
|
|
|
|
||||||
Choice: Peak Windowing | Clipping and Filtering | Peak Cancellation
Default: Peak Windowing
Double-click or use the drop-down menu to select the algorithm to perform CFR.
Range: 3 to 100
Default: 8
Set the PAPR value to achieve after CFR.
Range: 1 to 20
Default: 10
Specify the maximum times of iteration.With the increasing of iteration, the PAPR value should converge to a steady level.
Range: 10 to 1000
Default: 20
Coupling: Available when the CFR Algorithm is set to Peak Windowing.
Specify the maximum Kaiser window length. Instead of cutting off the peak directly, a window is applied over it with smooth transition edge. This parameter is to specify the maximum window length.
Range: 0 to 100%
Default: 100%
Coupling: Available when the CFR Algorithm is set to Peak Cancellation.
Specify the percentage that the cancellation pulses can be removed.
Range: 2 to 20
Default: 12
Coupling: Available when the CFR Algorithm is set to Peak Windowing.
Specify the Kaiser window parameter. It determines the rolling off of the window’s edge. With the decrease of Beta, the edge becomes steeper and sharper.
Range: 20 to Waveform Length
Default: 1000
Coupling: Available when the CFR Algorithm is set to Peak Cancellation.
Block is the range that a single cancellation pulse can be identified. If the waveform length is L, and the block size is B, then the number of blocks is N=floor(L/B)+1. Therefore, there will be N pulses at most to be removed.
Set the parameters to design a Parks-McClellan low pass filter in the menu below. The Parks-McClellan design method uses the Remez exchange algorithm to design linear phase FIR filters such that a filter has minimum weighted Chebyshev error in approximating a desired ideal frequency response. For more details, refer to Chapter 7.4.3 in "The Parks-McClellan Algorithm in Discrete-Time Signal Processing, 2nd ed".
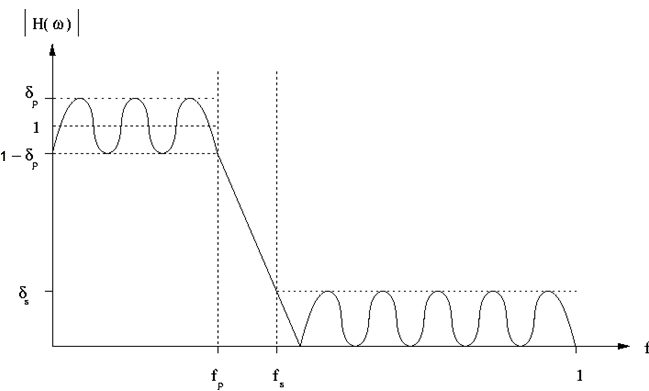
The filter can be depict as below, in which
fp is the pass frequency,
fs is the stop frequency,
δp is the pass ripple,
δs is the stop ripple.
Choice: On | Off
Default: Off
Double-click or use the drop-down menu to enable or disable the application of the filter.
Range: 1 to 2048
Default: 300
Set the maximum filter length. The filter’s length is clipped to the Maximum Order when the minimum filter length required to satisfy its specification exceeds the Maximum Order.
Range: 1 Hz to (Stop Frequency - 0.0015*Sample Rate*Resampling Ratio in Waveform block/2)
Default: 1.25 MHz
Set the pass frequency of the filter.
Range: 1 Hz to (0.5*Sample Rate value*Resampling Ratio in Waveform block)
Default: 1.5625 MHz
Set the stop frequency of the filter.
Range: 0.0001 to 5.0
Default: 0.01
Set the maximum ripple amplitude in the pass band.
Range: 6.0 to 200.0
Default: 50
Set the maximum ripple amplitude in the stop band.
A table is used to design a filter response in frequency domain. It’s only available when the CFR Algorithm is Peak Cancellation.
In the table, the frequency points are entered with an order of increasing frequency in unit of MHz, and its corresponding amplitude is in unit of dB.
When generating this filter mask, the frequency points between the specified points are linearly interpolated as shown in the Graph.
The CCDF graph view is located at the bottom of the Crest Factor Reduction setting window. It displays the probability (in percentage) that the waveform's (before CFR and after CFR) calculated peak-to-average power ratio (measured in dB) is greater than or equal to a specified level. The table above the CCDF plot displays the calculated peak-to-average values for the current waveform. For additional information, see Understanding CCDF Curves.
Click the Run the test flow button ![]() from the tool bar to run the test flow. If the Crest Factor Reduction block is set to On, the CCDF curves before CFR and after CFR will be plotted. If the Crest Factor Reduction block is set to Off, only the CCDF curve before CFR will be plotted.
from the tool bar to run the test flow. If the Crest Factor Reduction block is set to On, the CCDF curves before CFR and after CFR will be plotted. If the Crest Factor Reduction block is set to Off, only the CCDF curve before CFR will be plotted.
For the table above the CCDF plot, you can click on the down arrow ![]() button to choose between the Before CFR result and After CFR result. In the After CFR result, the ΔEVM value shows the deterioration to the signal after CFR.
button to choose between the Before CFR result and After CFR result. In the After CFR result, the ΔEVM value shows the deterioration to the signal after CFR.
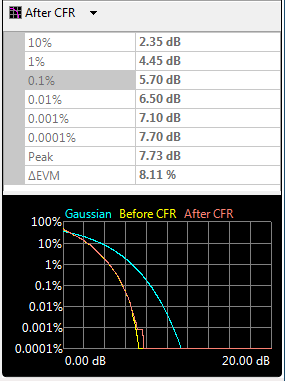
Three traces are displayed in the CCDF graph.
Gaussian distribution in green
CCDF before CFR in yellow
CCDF after CFR in red