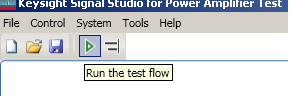
Before the user can adjust the timing to optimize envelope tracking, user need make system online which means makes all instrument now established communication with N7614C SW, this can be done via Run or Align action from the menu of N7614C.
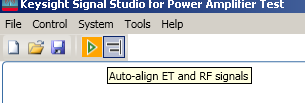
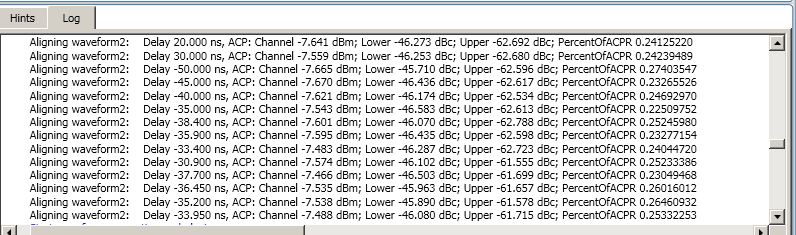
Align action will automatically handle the timing alignment of ET signal and 2 RF signals, the final result will be displayed on UI (see below). The accuracy will be effected by the waveform, RF power, shaping table PA performance and other components in the whole system. If the final result is not as good as user expected, N7614C also provide the ability to adjust the timing relation manually from the UI (Of course, one scope and some cables connection are needed).
Once a proper time alignment has completed , then Click on the Digital Predistortion block icon and turn it on. Click the Run button to play the signal and get the measurement results.
In the measurement view, there are four kinds of result windows: AM-AM, AM-PM, ACP, These three results give an insight of PA's improvement on linearity after using ET and DPD.
You can double-click on each window to enlarge it and double-click it again to return to the four-window view.
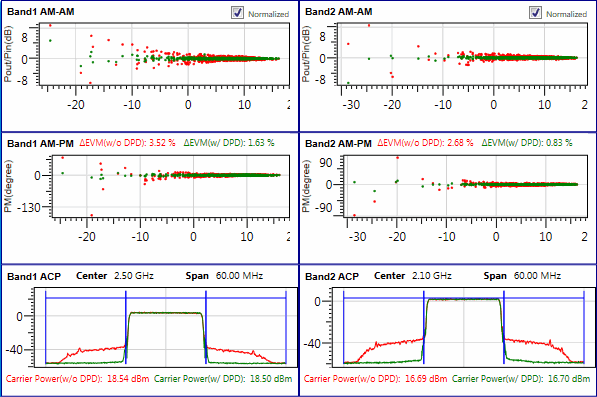
AM-AM curve displays ratio of the PA output signal amplitude to the PA input signal amplitude. So two signals are used use to plot the AM-AM curve. One is the reference signal that is the PA input signal. The other is the PA output signal, which is the IQ waveform data captured by the Signal Analyzer in the IQ Analyzer (Basic) mode.
There are two results: the red one shows the AM-AM value without using DPD, and the green one shows the AM-AM value after using DPD.
The check box determines whether to display the normalized value or not.
Normalized checked displays the PAout/PAin value
Normalized unchecked displays the PA output value
AM-PM curve displays ratio of the PA output signal phase to the PA input signal amplitude.
There are two results: the red one shows the AM-PM value without using DPD, and the green one shows the AM-PM value after using DPD.
The ACP results are from the ACP measurement results in the Spectrum Analyzer mode of the Signal Analyzer. It displays the improvements in ACP (Adjacent Channel Power Ratio) after using DPD.
There are four ACP settings in the right panel, In-Channel Bandwidth, Adjacent Channel Count, Adjacent Channel BW, and Channel Offset, in which In-Channel Bandwidth, Adjacent Channel BW, and Channel Offset are coupled to the Bandwidth settings in the Waveform block in the block view. If you want to view the ACP results of more than one adjacent channel, you can adjust the Adjacent Channel Count value. The results will be updated after you rerun the measurement.