Open topic with navigation
3. Executing the Measurement and Viewing Results
This section introduce how to execute the ET+DPD test and how to view the measurement results. Follow the procedure below to execute the measurement and view the measurement results.
Initial Run
Timing Alignment
Executing the Measurement
Viewing the Measurement Results
Initial Run
-
In ET+DPD test, it is recommended to run timing alignment first with DPD turned through. After timing alignment is finished, turn on DPD to run ET+DPD test.
-
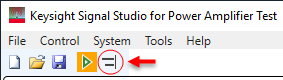
Click the  Run button on the tool bar to get the RF and ET waveform downloaded into the instrument and get the initial measurement results.
-
Once the measurement begins, the detailed information will be displayed in the Log view at the bottom of the window as shown below.
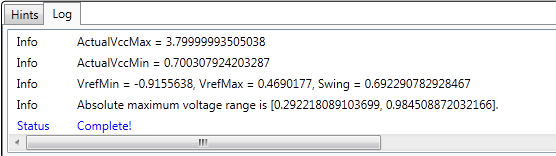
During the running process, you can stop it any time by clicking the Stop button. When you see the "Complete!" message in the Log view, it indicates that the measurement is completed.
The default Delay setting in Envelope Tracking block may not be the optimal value for the current instruments/DUT connections. So the PA output performance (AM-AM, ACP) may be poor. Further timing alignment between the RF Signal Generator and the Envelope Signal Generator is required.
Timing Alignment
Timing alignment is to synchronize the input signal of the PA (the output of the RF Signal Generator) with the input voltage of the PA (the output of the Envelope Signal Generator) in time domain. There are two methods:
If the related settings (e.g. sample rate, IQ delay, trigger delay in Generator instruments, etc.) are changed and applied, it’s recommended to do the timing alignment again.
Executing the Measurement
Once a proper time alignment has completed, the signal can be played repeatedly without re-alignment.
-
-
Click the Run button to play the signal and get the measurement results.
Viewing the Measurement Results
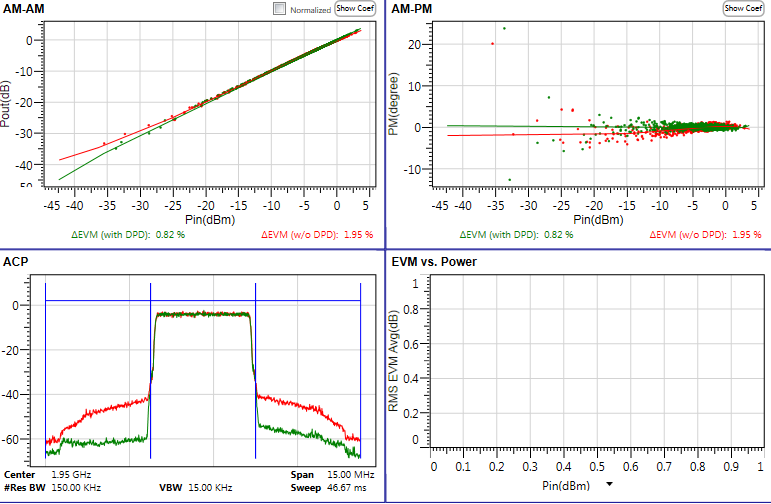
In the measurement view, there are four result windows: AM-AM, AM-PM, ACP, and EVM vs. Power. For ET+DPD test, only the first three results are used. These three results give an insight of PA's improvement on linearity after using ET and DPD.
You can double-click on each window to enlarge it and double-click it again to return to the four-window view.
You can make your own measurements, such as power-added efficiency (PAE) test, based on the PA output signal using the Keysight VSA software or applications on the Signal Analyzer.
AM-AM
AM-AM curve displays ratio of the PA output signal amplitude to the PA input signal amplitude. So two signals are used use to plot the AM-AM curve. One is the reference signal, that is the PA input signal. The other is the PA output signal, which is the IQ waveform data captured by the Signal Analyzer in the IQ Analyzer(Basic) mode.
There are two results: the red one shows the AM-AM value without using DPD, and the green one shows the AM-AM value after using DPD.
There is also a "Normalized" check box in the window. Check it or uncheck it will decide whether to display the normalized value or not.
-
Normalized: It displays the PAout/PAin value
-
Not normalized: It displays the PA output value
AM-PM
AM-PM curve displays ratio of the PA output signal phase to the PA input signal amplitude.
There are two results: the red one shows the AM-PM value without using DPD, and the green one shows the AM-PM value after using DPD.
ACP
The ACP results are from the ACP measurement results in the Spectrum Analyzer mode of the Signal Analyzer. It displays the improvements in ACP (Adjacent Channel Power Ratio) after using DPD.
There are four ACP settings in the right panel, In-Channel Bandwidth, Adjacent Channel Count, Adjacent Channel BW, and Channel Offset, in which In-Channel Bandwidth, Adjacent Channel BW, and Channel Offset are coupled to the Bandwidth settings in the Waveform block in the block view. If you want to view the ACP results of more than one adjacent channel, you can adjust the Adjacent Channel Count value. The results will be updated after you rerun the measurement.
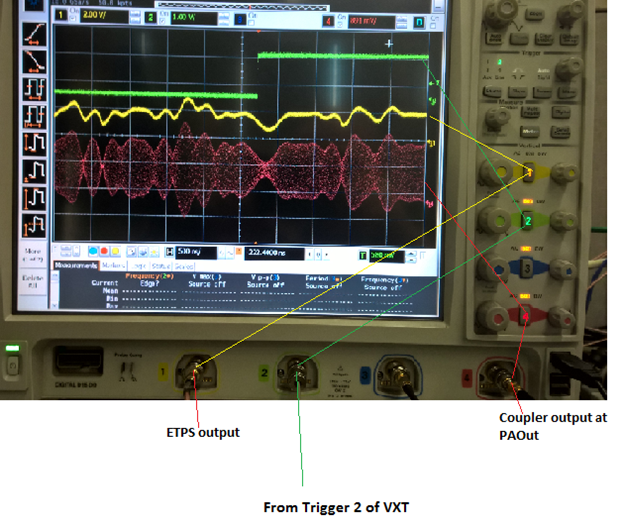
In case you want to change the delay between envelope signal and RF signal manually, connect the Trigger 2 output of VXT and envelope signal and part of the RF signal (through a RF coupler) to the oscilloscope channels as shown in the figure below:
Envelope tracking can be disabled only if the DPD operation is needed. Follow the normal DPD operation after disabling envelope tracking.