Click the triangle  Run button on the menu bar and tool bar.
Run button on the menu bar and tool bar. 
Once the measurement begins, the detailed information will be displayed in the Log view at the bottom of the window as shown below.
During the running process, you can stop it any time by clicking the Stop button. When you see the "Complete!" message in the Log view, it indicates that the measurement is completed.
Stop button. When you see the "Complete!" message in the Log view, it indicates that the measurement is completed. 
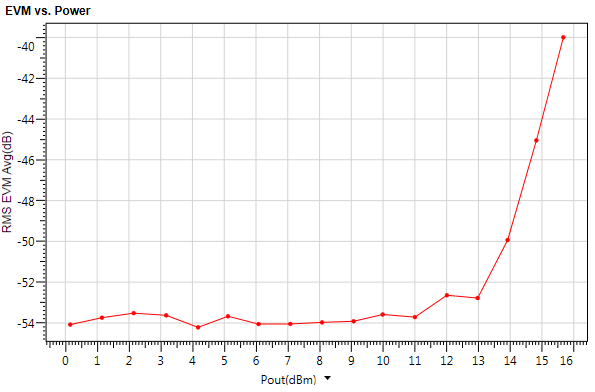
 button below X-axis to change the X-axis value to the output power of the PA.