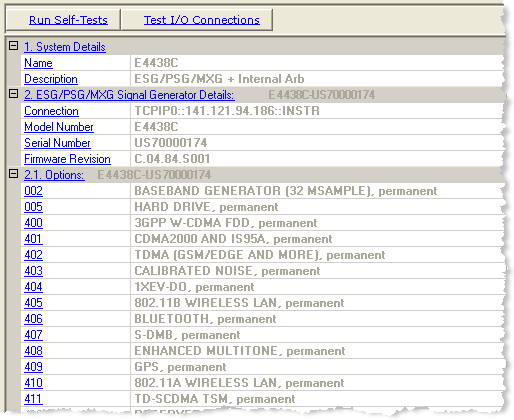
 property pane
shows <Simulated Hardware> in the
and cells, and N/A
in most of the other cells.
property pane
shows <Simulated Hardware> in the
and cells, and N/A
in most of the other cells.Select this view to display read-only information about the hardware
system. When using simulated hardware,
the  property pane
shows <Simulated Hardware> in the
and cells, and N/A
in most of the other cells.

Click this button to run an I/O interface connection test between the instrument and the PC. performs the same tests as the button.
The Self-Tests  window
appears and displays the results of the tests. Closing the test dialog
window changes the display from the hardware node to the waveform setup
node.
window
appears and displays the results of the tests. Closing the test dialog
window changes the display from the hardware node to the waveform setup
node.
If an error occurs, a  red X
appears next to the failed test and an error message is displayed in the
status area.
Click this button to run an I/O interface connection test between the instrument and the PC. performs the same tests as the button.
The Test I/O Connections  window
appears and displays the results of the tests. Closing the test dialog
window changes the display from the hardware node to the waveform setup
node.
window
appears and displays the results of the tests. Closing the test dialog
window changes the display from the hardware node to the waveform setup
node.
If an error occurs, a  red X
appears next to the failed I/O connection and an error message is displayed
in the status area.
View the name assigned to the system when it is configured with the wizard.
View the hardware configuration type.
View the connectivity method, such as LAN or GPIB.
View the instrument model number.
View the instrument serial number.
View the instrument firmware revision number.
View the list of options installed on the selected instrument.
For a complete description of the available instrument options, see the instrument's data sheet.