Clicking or in the tree view to view graphs, which is divided into two areas: the CCDF plot on the left side and the waveform plot on the right side. A waveform can only be plotted after it has been generated.
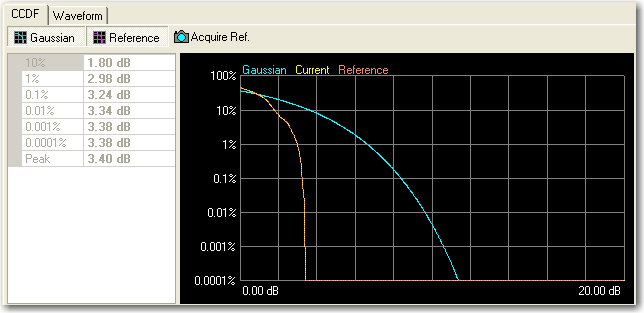
The complementary cumulative distribution function (CCDF) plot displays the probability (in percentage) of the generated waveform's calculated peak-to-average power ratio (measured in dB) meeting or exceeding a certain level. The table to the left of the CCDF plot displays the calculated peak-to-average values for the current waveform, which is the yellow curve. For additional information, see Understanding CCDF Curves.
In addition to the waveform's current plot (yellow), the Gaussian noise reference curve are also displayed in shades of gray, enabling you to make comparisons of waveform characteristics as you adjust parameters.
Click the button to toggle the view of the band-limited Gaussian noise curve (blue).
Click the button to toggle the view of the reference curve (red). The reference appears as a flat line until you generate a waveform and click the button.
Click the button to make the current waveform curve (yellow) the reference curve (red). Click the button to view the reference curve.
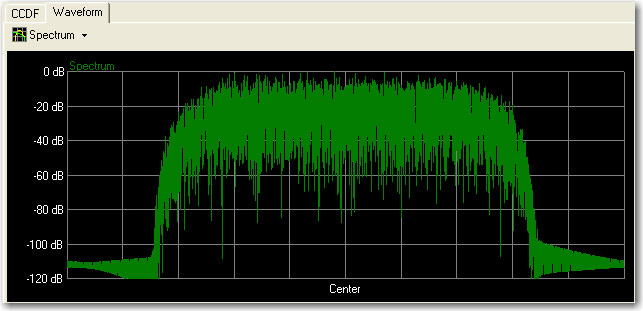
 Click this button to select from the list of different
waveform plots. Selections include
Click this button to select from the list of different
waveform plots. Selections include  Power,
I+Q,
I|Q,
and Spectrum.
Each click selects the next plot type in the list. You can also click
the arrow to access a drop-down menu where you can make a direct selection.
Power,
I+Q,
I|Q,
and Spectrum.
Each click selects the next plot type in the list. You can also click
the arrow to access a drop-down menu where you can make a direct selection.