Real Time
Waveform Graph
Click or in the .
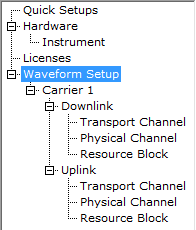
The graph view is located at the bottom of the Waveform Setup and Carrier
nodes, and in the Library Waveform Manager's Library Manager window (i.e. power  Spectrum view only). For multiple antenna configurations, a tab for each antenna port
is displayed above the graph view. Click the tab of the antenna port for
which you want to view a waveform graph. Click the Waveform tab to display
the waveform graph.


The CCDF, Waveform, and Power Envelope graphs are minimized
in the initial view of the Carrier node. To
view the graphs,  click and drag the border
above the CCDF, Waveform, and Power Envelope graphs.

Click  or
or
 from the main tool bar to generate an I/Q waveform and plot four different
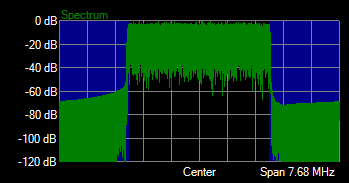
waveform graphs (Power, I+Q, I/Q, and Spectrum) of
the current waveform configuration. Changes to the waveform configuration
do not appear on the graph until you generate the waveform. The status
bar at the bottom of the screen shows waveform generation progress.
The plot is shown in the Figure.

Figure. Power plot
Click the down arrow  to open a
from which you can select different waveform plots. Selections include
Power (shown above), I+Q, I|Q, and
Spectrum. Click the button to the left of the arrow
  to select the next plot type in the list
without displaying the menu.

Related Topics
CCDF
Graph
Power Envelope Graph
 tree view.
The graph view is located at the bottom of the Waveform Setup and Carrier
nodes, and in the Library Waveform Manager's Library Manager window (i.e. power
  Spectrum view only). For multiple antenna configurations, a tab for each antenna port
is displayed above the graph view. Click the tab of the antenna port for
which you want to view a waveform graph. Click the Waveform tab to display
the waveform graph.


 or
or
 from the main tool bar to generate an I/Q waveform and plot four different
waveform graphs (Power, I+Q, I/Q, and Spectrum) of
the current waveform configuration. Changes to the waveform configuration
do not appear on the graph until you generate the waveform. The status
bar at the bottom of the screen shows waveform generation progress.
 to open a
  to select the next plot type in the list
without displaying the menu.