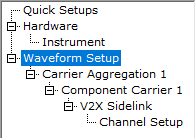
Click Waveform Setup or Carrier in the ![]() tree view .
The graph view is located below the Waveform Setup property grid. Click the CCDF tab to display
the CCDF graph.
tree view .
The graph view is located below the Waveform Setup property grid. Click the CCDF tab to display
the CCDF graph.
The CCDF graph displays the probability (in percentage) that the generated waveform's calculated peak-to-average power ratio (measured in dB) is greater than or equal to a specified level. The table to the left of the CCDF plot displays the calculated peak-to-average values for the current waveform. For additional information, see Understanding CCDF Curves.
Click Generate Waveform  or Generate and Download
  from the main tool bar to generate an I/Q waveform and plot the CCDF graph
using the current channel configuration. Changes to the channel configuration
setup do not update the graph until you generate the waveform. The
status bar at the bottom of the screen shows waveform generation progress.
from the main tool bar to generate an I/Q waveform and plot the CCDF graph
using the current channel configuration. Changes to the channel configuration
setup do not update the graph until you generate the waveform. The
status bar at the bottom of the screen shows waveform generation progress.
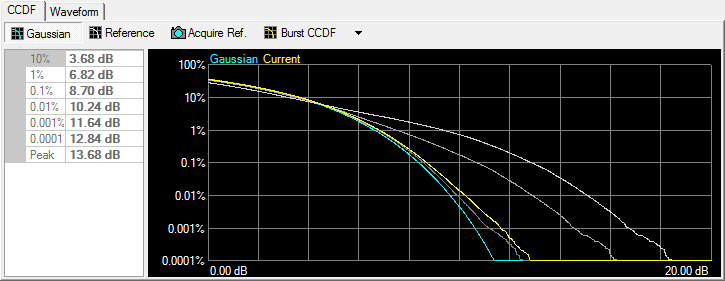
Use the buttons shown below to plot the Gaussian data, reference data, and generated waveform data to the CCDF graph. The graph's initial state shows only the Gaussian curve (blue) until you generate a waveform.

Click the Gaussian button to toggle the Gaussian noise curve (blue) on or off.

Click the Reference button to toggle the reference curve (red) on or off.

Click the Acquire Ref. button to set the current waveform curve as the reference curve.


Click the Waveform CCDF/Burst CCDF button to select the range of the CCDF calculation.
Burst CCDF calculates the CCDF curve based on the generated I/Q waveform, excluding the off power period.
Waveform CCDF calculates the CCDF curve based on entire generated I/Q waveform.