This topic describes how to use the resource mapping graph.
For improved viewing, you can enlarge the resource mapping graph by dragging the borders with your mouse pointer.
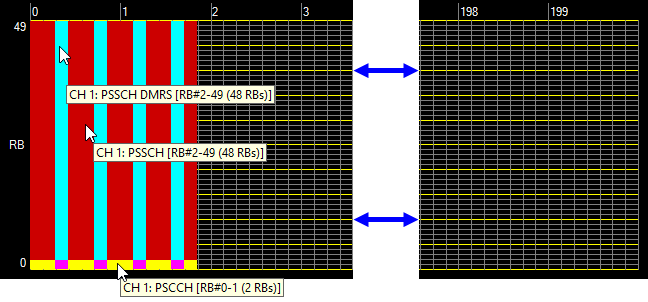
When you place the cursor over a collection of occupied resource blocks (any solid color), the associated channel and resource block information is displayed, as shown in Figure 1. Resource Block Collections below. Unoccupied resource blocks are dark and show the grid.
Figure 1. Resource Block Collections
The numbering across the top of the resource mapping graph (0 to 199 in this example) corresponds to the number of slots. The software adjusts this numbering automatically based on the Waveform Generation Length setting in the Component Carrier n node.
The horizontal width of each slot represents the number of OFDM symbols in the time domain, corresponding to the number of OFDM symbols per slot, as displayed in Number of Symbols in Slot in the V2X Sidelink node.
The numbers to the left of the resource mapping graph (0 to 49 in this example) correspond to resource block positions in the frequency domain. The number of resource blocks displayed is determined by the System Bandwidth selected in the V2X Sidelink node. In this example, the System Bandwidth is 10 MHz (50 RB), so the corresponding number of resource blocks is 50.
Each resource block contains 12 subcarriers in the frequency domain, as displayed in Number of Subcarriers in Resource Block in the V2X Sidelink node. The red rectangle in Figure 2. One Resource Block indicates one resource block made up of 7 OFDM symbols (horizontally) and 12 subcarriers (vertically). Each resource block therefore consists of 7x12 = 84 resource elements.
