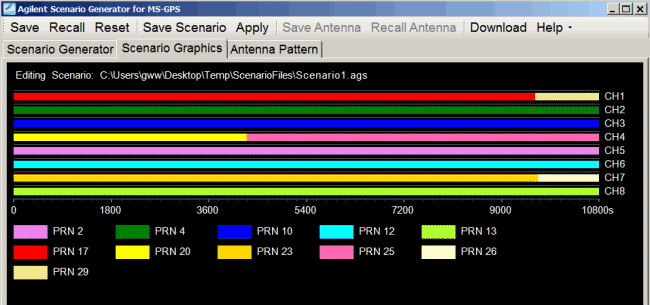
The Scenario Graphics tab is divided into two parts: a graphic panel on the top and a log generation window at the bottom. The graphic panel illustrates the content of the selected scenario with each satellite channel represented by a colored line. In a single line, the color change point indicates a satellite transition occurring on that channel. The user can refer to the color legend below or move mouse on top of the colored line to get the PRN represented by a specific color. The color Black on a channel line means that no signal is transmitted on the channel at that period. The time axis of the scenario is displayed at the bottom of channel lines. The content of the graphic panel is updated when a new scenario file is successfully created or a new scenario file is selected in the scenario generator editor.

The log generation window provides information on the scenario generation process, including the scenario header, generation results, warnings and errors. The log window is appended when the Create Scenario, Save Scenario or Apply buttons are pressed or when a scenario is loaded for editing. Use these logs for diagnostic purposes, for example, to check the correctness of input parameters. The log information can be saved in scenario editing mode by setting the Save Edit Log Parameter to On in the Scenario Generator tab.
