
The graph shows measurement data with measurement data as the vertical y-axis and relative time as the horizontal x-axis.
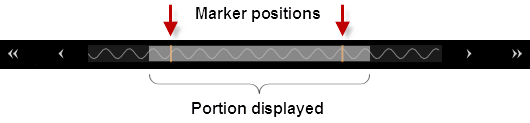
The Data Preview Bar gives a visual indication of the portion of the data that is currently displayed in the chart. The area highlighted in grey is the portion of the data that is currently displayed.

|
Set the x-axis grid labels. Select from "Relative to Zero" (default), "Date Time" in local time, or "Date Time (UTC)" relative to Universal Time Coordinated time. |

|
Show vertical markers. Click |

|
Area zoom. Use the mouse to draw a frame around the desired area of the graph to zoom in on. |

|
Zoom in horizontally. To zoom in vertically only, click on the waveform (waveform turns into a thick line) and zoom in. Click the waveform again to return to the normal zoom mode. |

|
Zoom out horizontally. To zoom out vertically only, click on the waveform (waveform turns into a thick line) and zoom out. Click the waveform again to return to the normal zoom mode. |

|
Auto scale the trace on both the x- and y-axis. |

|
Auto scale the trace on the x-axis. |

|
Auto scale the trace on the y-axis. |

|
Automatically scroll new trace data from the right side of chart. Click the drop-down arrow next to this icon to auto scale the x-axis, y-axis, or both when appending new trace data. |
Trace data for each marker is displayed below the graph. For example:

Right-click anywhere on the chart to display these options:
Save Chart Image to File - Export a screen shot of the chart to a JPEG, BMP, or PNG file. For all file formats, the chart is saved with a white grid on a black background. By default, the screen shot is stored in the "My Documents" folder on your computer. For example – C:\Users\<user_name>\Documents\Keysight\BenchVue\LCR Meter\Exports\.
Copy Chart Image to Clipboard - Export a screen shot of the chart to the Windows clipboard.
 to hide the vertical markers. See