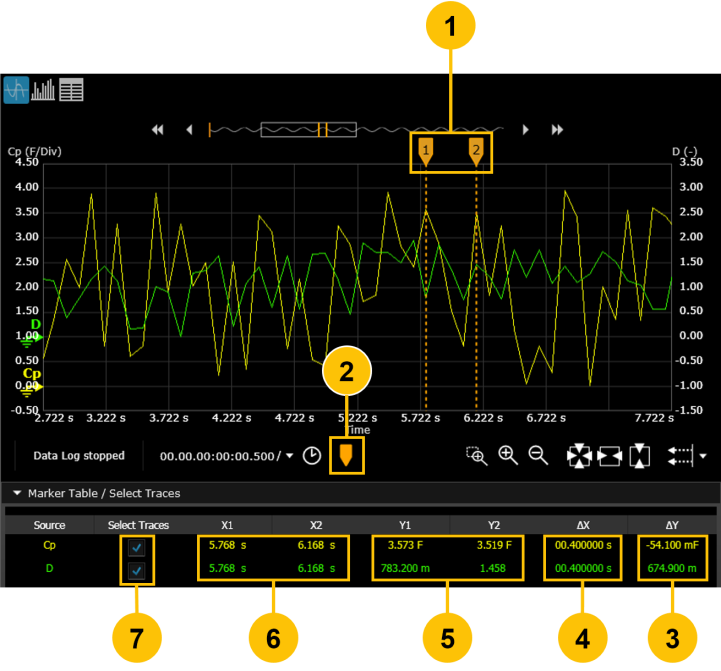
In the Graph view only, you can position two vertical markers for deeper analysis of the selected traces. You can position each set of markers to display the relative measurement data between the markers (∆X and ∆Y). When enabled, markers appear on the chart as sets of two vertical dashed yellow lines as shown below.
| 1 | Vertical markers (time axis) are labeled 1 and 2. Drag the dashed lines left or right to the desired position. | |
| 2 | Click to toggle vertical markers on or off. | |
| 3 | The relative difference (∆Y) between the y-axis intersection of the markers and the selected traces. | |
| 4 | The relative difference (∆X) between the x-axis intersection of the markers and the selected traces. | |
| 5 | The current values for y-axis intersection of the markers and the selected traces. | |
| 6 | The current values for x-axis intersection of the markers and the selected traces. | |
| 7 | Select the desired source traces to be displayed. |
If the markers are not being displayed on the graph, click  to display markers.
To position the markers, click  or
or  and drag the marker left or right. The example above shows marker 1 and marker 2 positioned on the graph, with the corresponding marker measurement data displayed below the graph.
When a marker is moved off the graph (by zooming in on the trace, for example), it appears at the upper left or right corner of the graph.
To hide the markers, click  .
.